Fig. 6.
Download original image
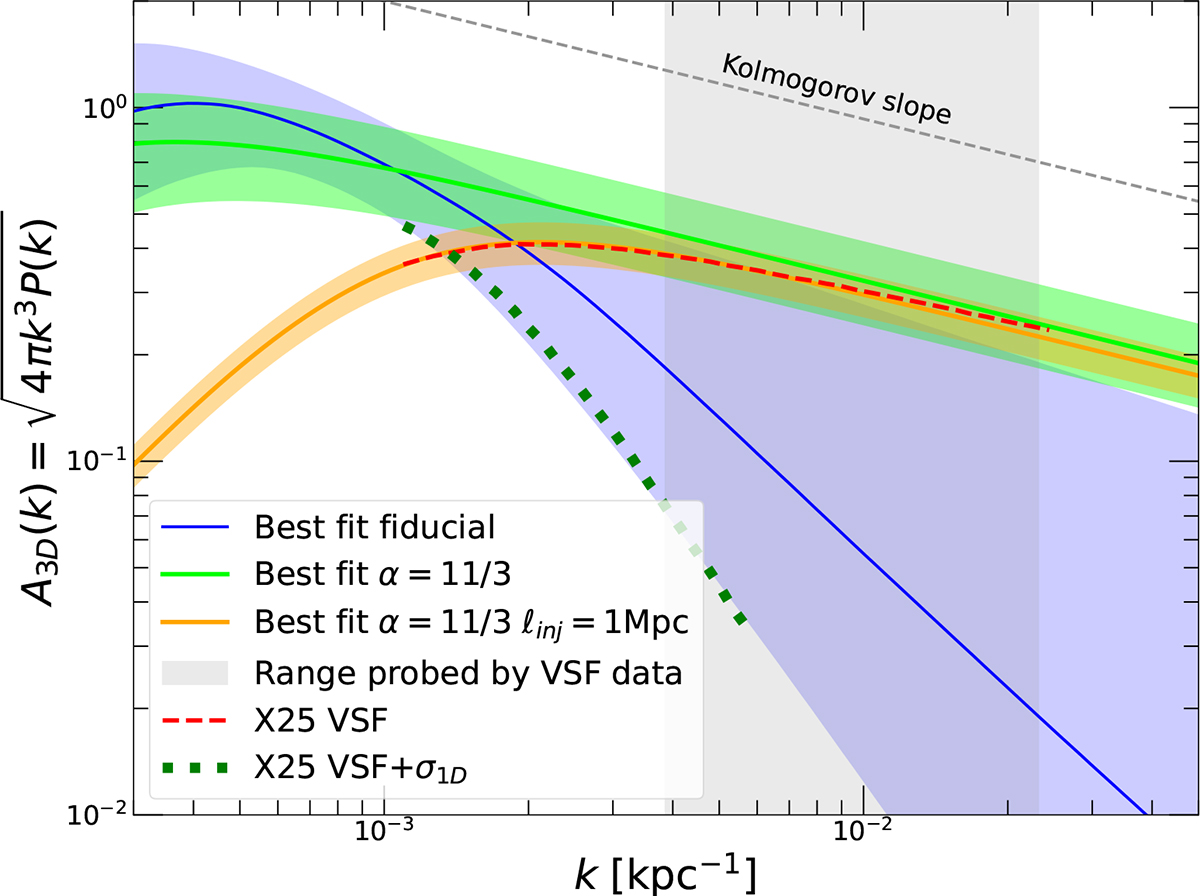
Amplitude of velocity fluctuations as a function of wave number for the Coma cluster. The curves are calculated from the posterior distribution of model parameters for a model with free power-law slope (blue), a model with Kolmogorov slope α = 11/3 (light green), and a model with Kolmogorov slope and ℓinj = 1 Mpc (orange). The solid curves and the shaded areas show the median and the 1σ error envelope of the fitted models. The dashed red curve shows the X25 model fitted to the VSF only, whereas the dotted green curve represents the fit to the VSF and velocity dispersion data from X25. For comparison, the gray shaded area shows the range of scales probed by the bulk velocity data, whereas the gray dashed line indicates the Kolmogorov slope.
Current usage metrics show cumulative count of Article Views (full-text article views including HTML views, PDF and ePub downloads, according to the available data) and Abstracts Views on Vision4Press platform.
Data correspond to usage on the plateform after 2015. The current usage metrics is available 48-96 hours after online publication and is updated daily on week days.
Initial download of the metrics may take a while.