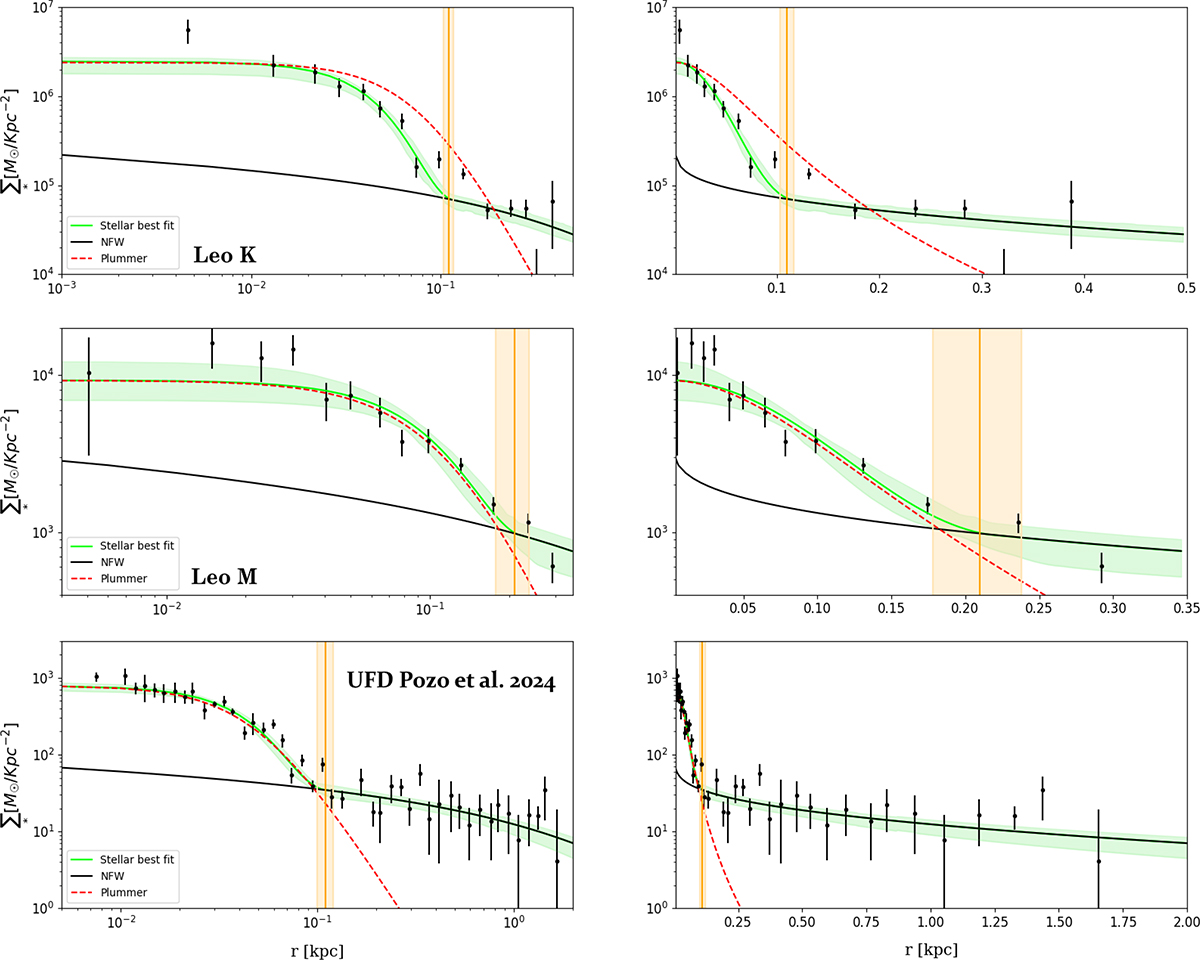
Fig. 1.
Download original image
Star-count profiles. The binned star counts for Leo K and M (McQuinn et al. 2024) are compared with the standard Plummer profile shown as the red dashed curve that can be seen to be increasingly in tension at a large radius. The ψDM profile is shown by the green band for our Markov Chain Monte Carlo (MCMC)-based range of acceptable fits, with its soliton core component and an outer Navarro-Frank-White (NFW) profile. The radius of the soliton component is set by the de Broglie scale, and there is a characteristic sharp density drop between the core and the halo predicted in the simulations to be typically a factor of ≃30, which we mark as the transition radius by the vertical orange band. Note that the right panel has a linear-log scale that helps us appreciate the extent of the outer halo present in the data. In the bottom row, we plot the sum of all star count profiles of recognized UFDs in the Local Group, showing the clear core-halo form and best fitting ψDM profile derived by Pozo et al. (2024) to illustrate the similarity with Leo K and M.
Current usage metrics show cumulative count of Article Views (full-text article views including HTML views, PDF and ePub downloads, according to the available data) and Abstracts Views on Vision4Press platform.
Data correspond to usage on the plateform after 2015. The current usage metrics is available 48-96 hours after online publication and is updated daily on week days.
Initial download of the metrics may take a while.