Fig. 3.
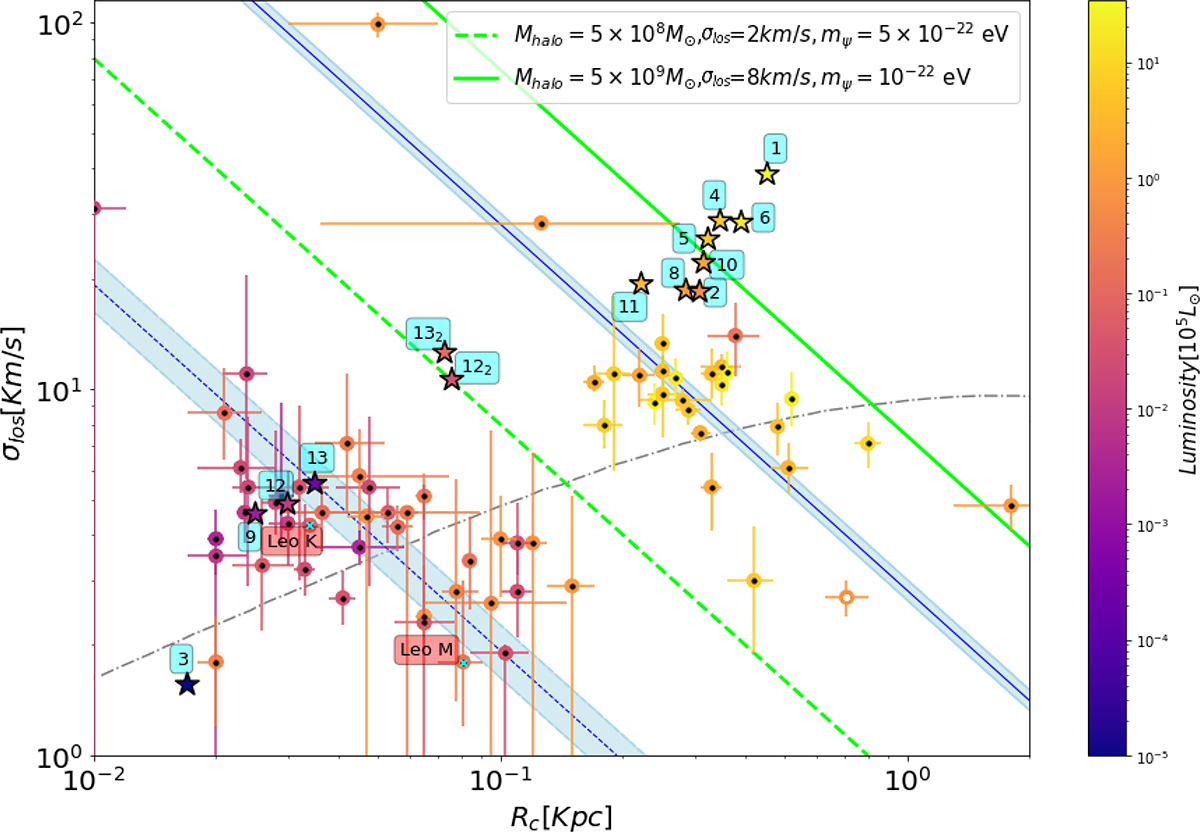
Download original image
Velocity dispersion versus core radius. The observed velocity dispersion is plotted against the core radius for all dSph and UFD dwarfs, comparing them with the inverse relation, d log σc/d log rc = −1, required by the uncertainty principle; this is shown via diagonal lines. Since the values of σc are not available for the galaxy dataset, we used σlos instead. The best fits to the UFD and dSPh dwarfs are indicated in blue, with the corresponding boson masses of ψDM derived from the normalization listed in the legend. The parallel green lines correspond to the boson masses adopted in our simulation, which do not coincide precisely with the best-fit values found in the data (as indicated by the blue lines). Also overlaid is an approximate CDM-related prediction (Walker et al. 2009) as a dotted gray curve, where galaxies with NFW profiles are naturally predicted to be larger with increasing galaxy mass, i.e., with the opposite sign to the negative-slope ψDM relation. Crater II is marked with a white point.
Current usage metrics show cumulative count of Article Views (full-text article views including HTML views, PDF and ePub downloads, according to the available data) and Abstracts Views on Vision4Press platform.
Data correspond to usage on the plateform after 2015. The current usage metrics is available 48-96 hours after online publication and is updated daily on week days.
Initial download of the metrics may take a while.