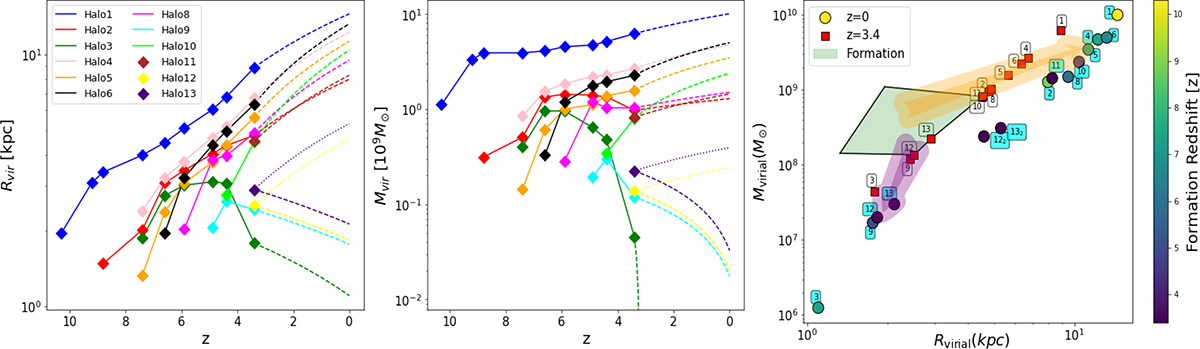
Fig. 4.
Download original image
Evolution of virial mass (left), radius (center), and virial mass versus radius (right). Solid lines trace the evolution of these quantities across all simulation snapshots (as projected in Fig. A.2), with extrapolation to z = 0 shown as dashed lines, as described in the appendix. Right panel shows virial mass versus radius (left), with the last snapshot marked with red squares (z = 3.4), to illustrate that the predicted bimodality is inherent rather than a product of our extrapolations to z = 0. Arrows in the right panel indicate the evolutionary trend for the two galaxy classes (orange for dSphs and purple for UFDs), with the green area encompassing formation values. The low-mass galaxies all suffer some level of tidal stripping of one or both boson components, and we highlight the sensitivity to tidal effects for the heavy boson-dominated halos 12 and 13 by extrapolating two possible scenarios: one in which they experience tidal stripping similarly to the other UFDs (purple arrow) and another in which they remain unaffected (orange arrow). The latter case is represented by the markers 122 and 132, with the corresponding dotted lines in the figure. All quantities are shown in physical units.
Current usage metrics show cumulative count of Article Views (full-text article views including HTML views, PDF and ePub downloads, according to the available data) and Abstracts Views on Vision4Press platform.
Data correspond to usage on the plateform after 2015. The current usage metrics is available 48-96 hours after online publication and is updated daily on week days.
Initial download of the metrics may take a while.