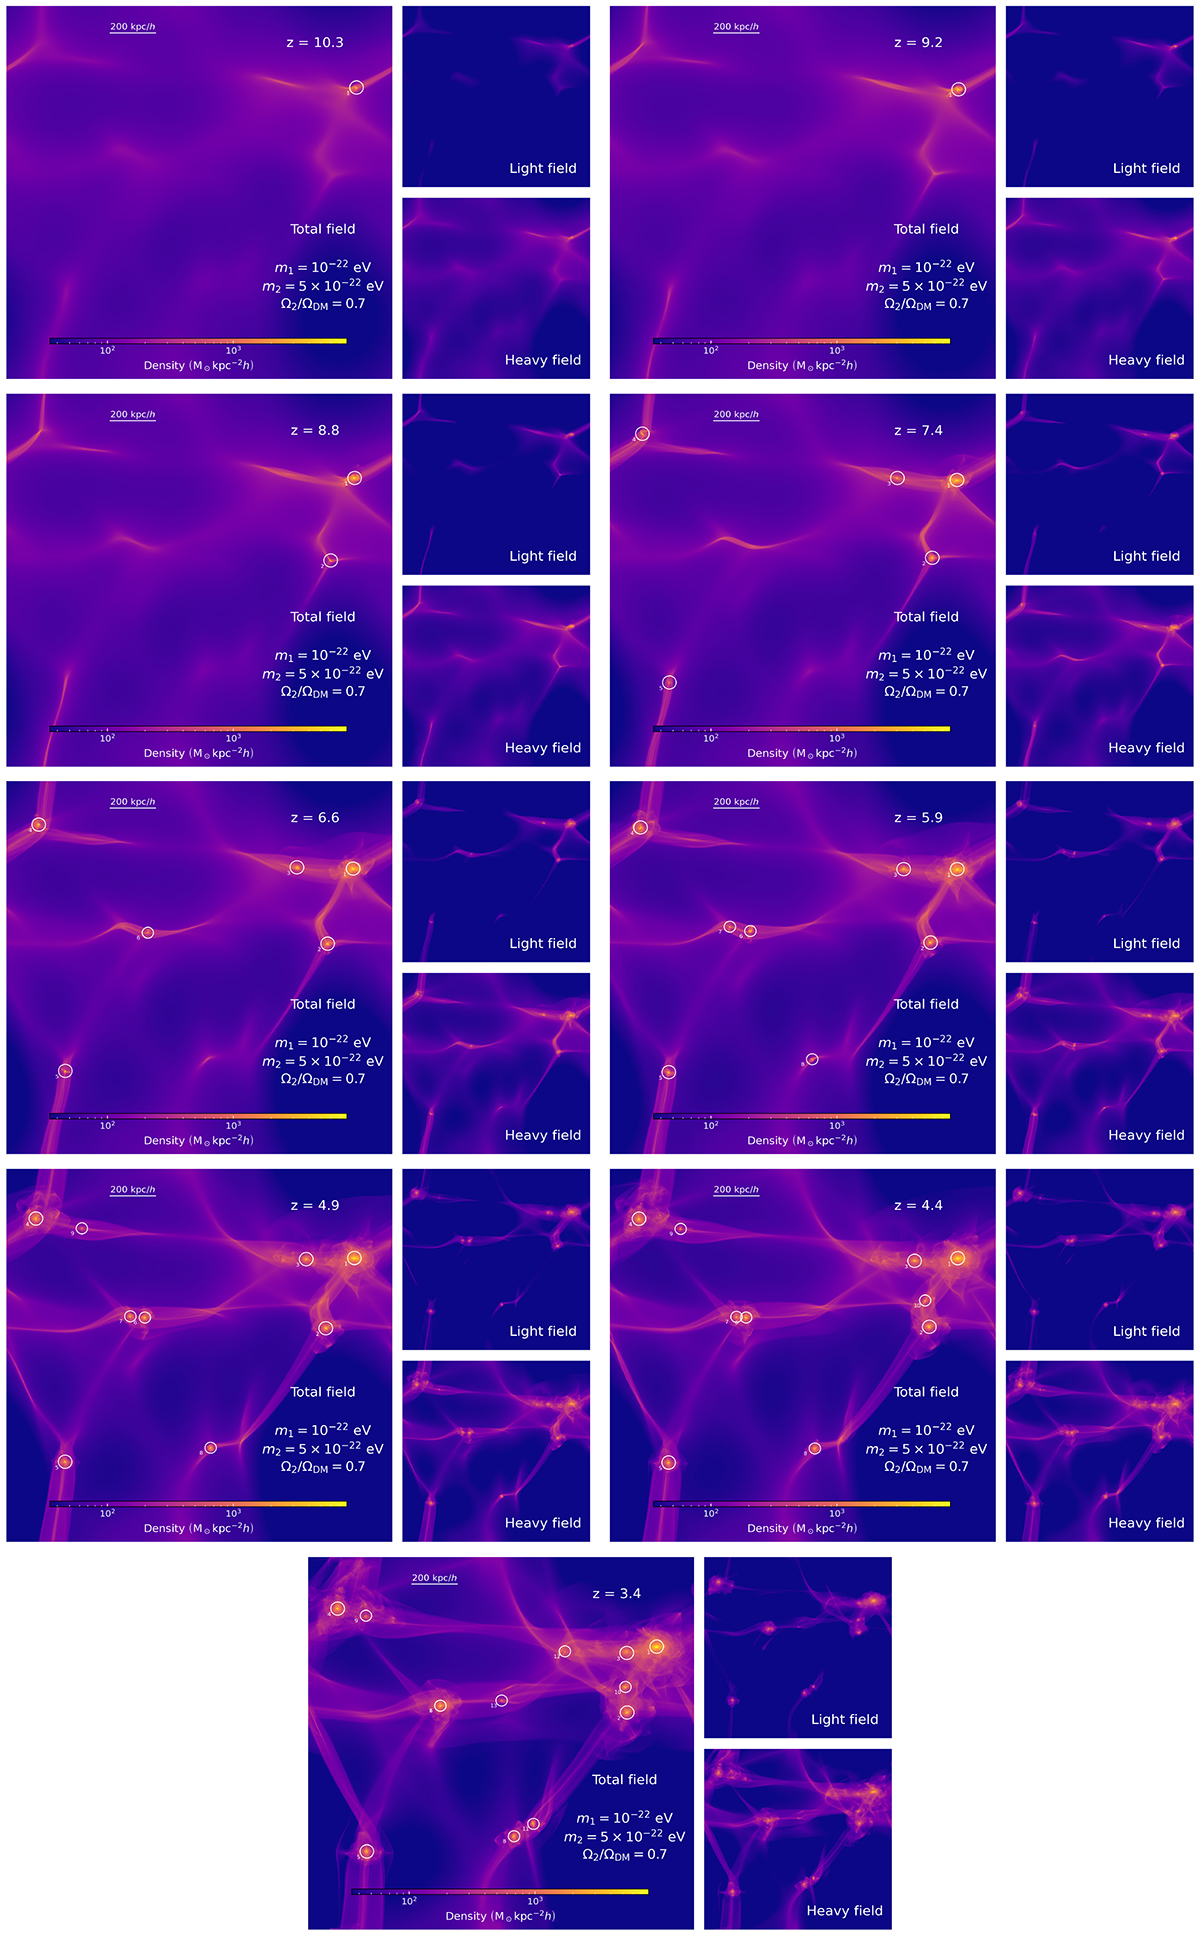
Fig. A.2.
Download original image
Projected densities of the total field within the simulation volume are shown at various redshifts. White circles highlight all haloes exhibiting a solitonic core structure at the corresponding redshift, as indicated in each panel. The labels next to each halo reflect their approximate formation sequence, with lower numbers representing earlier-forming haloes. Note that halos 6 and 7 have merged by the final timestep.
Current usage metrics show cumulative count of Article Views (full-text article views including HTML views, PDF and ePub downloads, according to the available data) and Abstracts Views on Vision4Press platform.
Data correspond to usage on the plateform after 2015. The current usage metrics is available 48-96 hours after online publication and is updated daily on week days.
Initial download of the metrics may take a while.