Fig. 1
Download original image
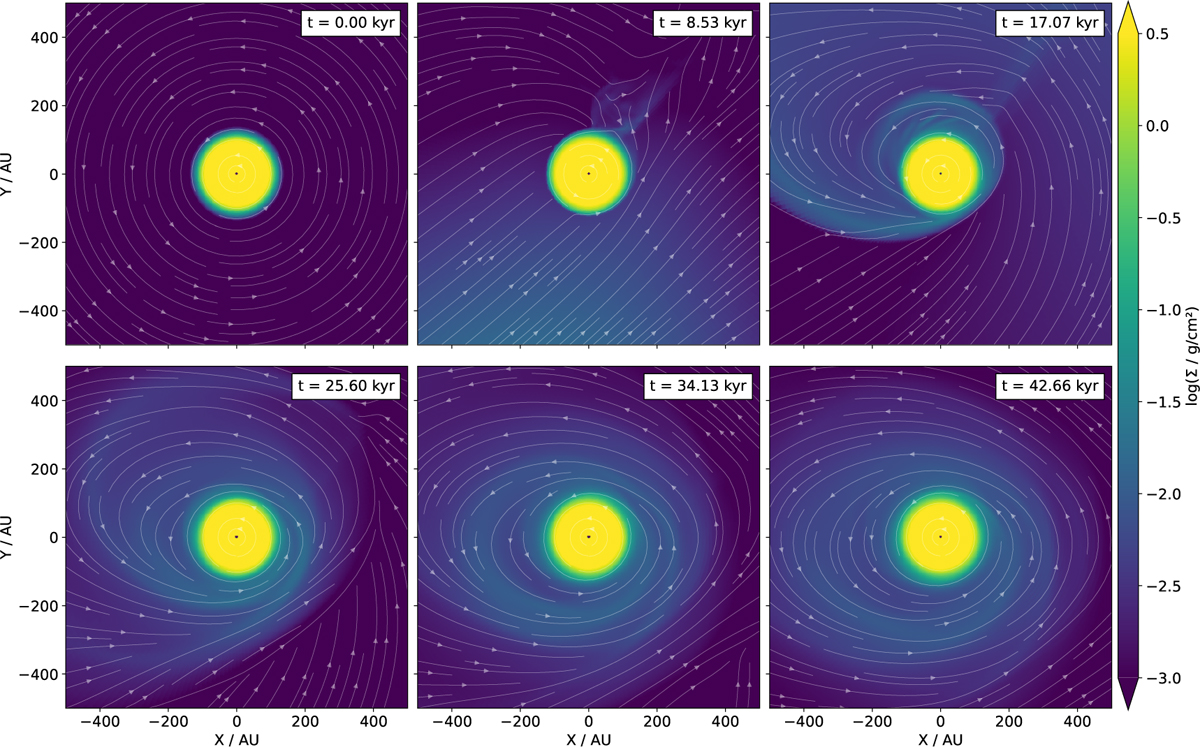
Gas column density of the cloudlet encounter simulation, for six different points in time. The perspective is face-on. The white arrows show the velocity streamlines, computed as a mass-weighted average along the line of sight. The color scale was chosen to highlight low-density features, thereby saturating the protoplanetary disk.
Current usage metrics show cumulative count of Article Views (full-text article views including HTML views, PDF and ePub downloads, according to the available data) and Abstracts Views on Vision4Press platform.
Data correspond to usage on the plateform after 2015. The current usage metrics is available 48-96 hours after online publication and is updated daily on week days.
Initial download of the metrics may take a while.