Fig. 3
Download original image
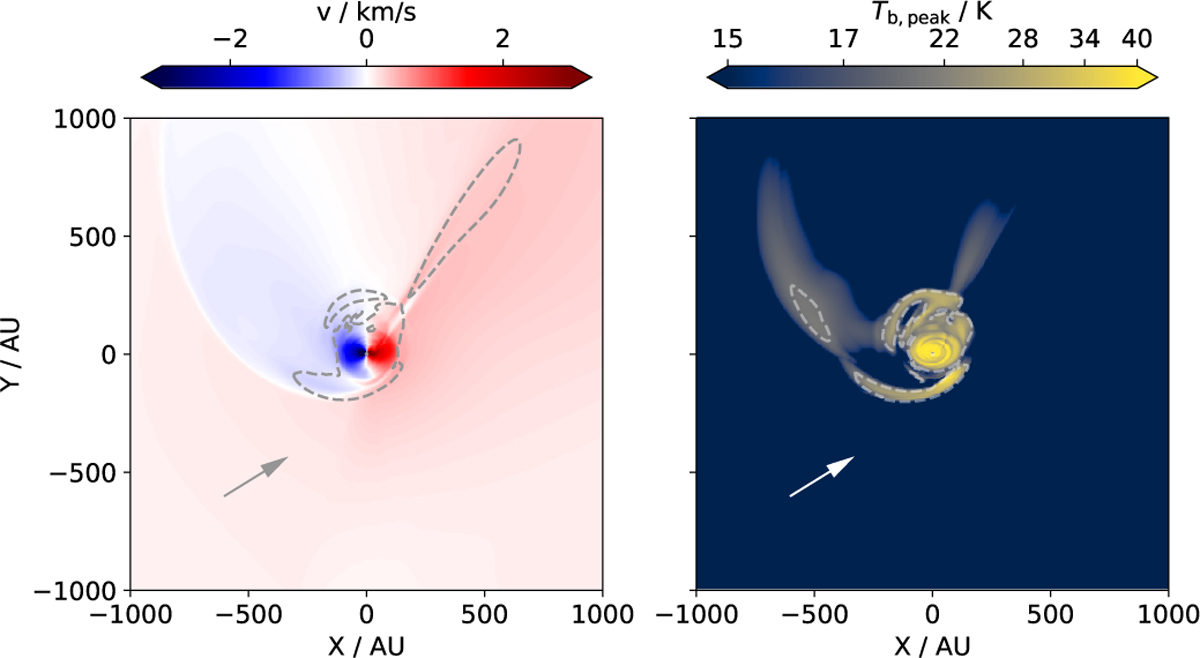
Synthetic CO line emission (J 2-1) at t = 17.07 kyr for the cloudlet encounter simulation. The left panel shows the moment 1 map, with the gray dashed line showing the 600 mJy arcsec−2 km s−1 moment 0 contour. The right panel shows the peak brightness temperature on a square root scale. The gray and white arrows represent the initial orbital velocity of the cloudlet. The white dashed line in the right panel represents the Tb,peak = 20 K contour line.
Current usage metrics show cumulative count of Article Views (full-text article views including HTML views, PDF and ePub downloads, according to the available data) and Abstracts Views on Vision4Press platform.
Data correspond to usage on the plateform after 2015. The current usage metrics is available 48-96 hours after online publication and is updated daily on week days.
Initial download of the metrics may take a while.