Fig. 5
Download original image
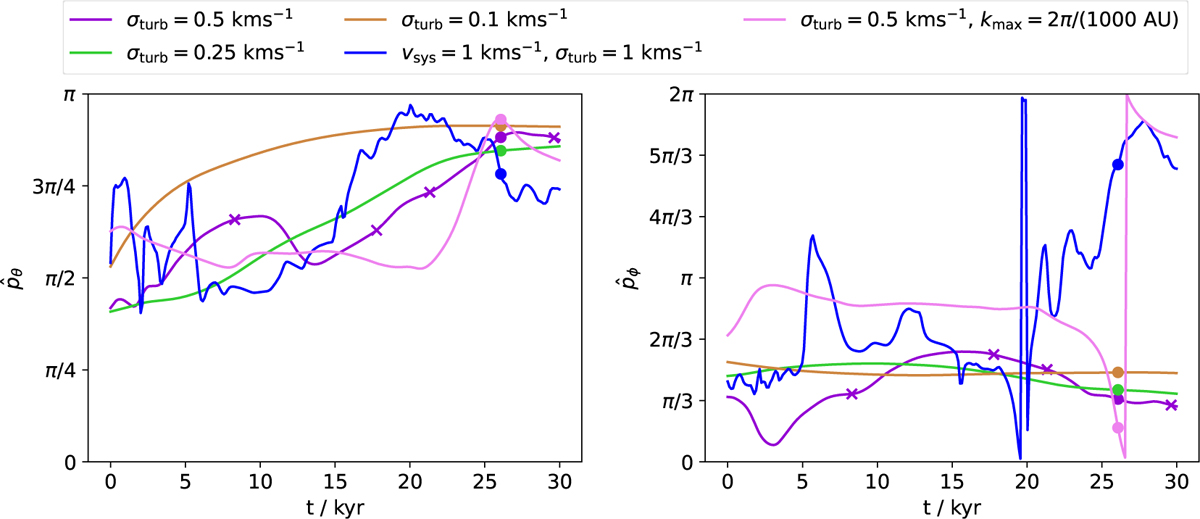
Orientation of the non-systemic momentum flux through a spherical shell with radius Rbound as a function of time. The differently colored lines denote different simulations from Table 1. Unless stated otherwise, the shown simulations have vsys = 0.5 km s−1 and kmin = 2π/50 AU. The round markers show the physical time of the snapshot used for the synthetic observations. The cross markers show the physical time of the snapshots used for the time series in Fig. 8. The left panel shows the azimuthal angle θ, and the right panel shows the polar angle φ.
Current usage metrics show cumulative count of Article Views (full-text article views including HTML views, PDF and ePub downloads, according to the available data) and Abstracts Views on Vision4Press platform.
Data correspond to usage on the plateform after 2015. The current usage metrics is available 48-96 hours after online publication and is updated daily on week days.
Initial download of the metrics may take a while.