Open Access
Fig. 7
Download original image
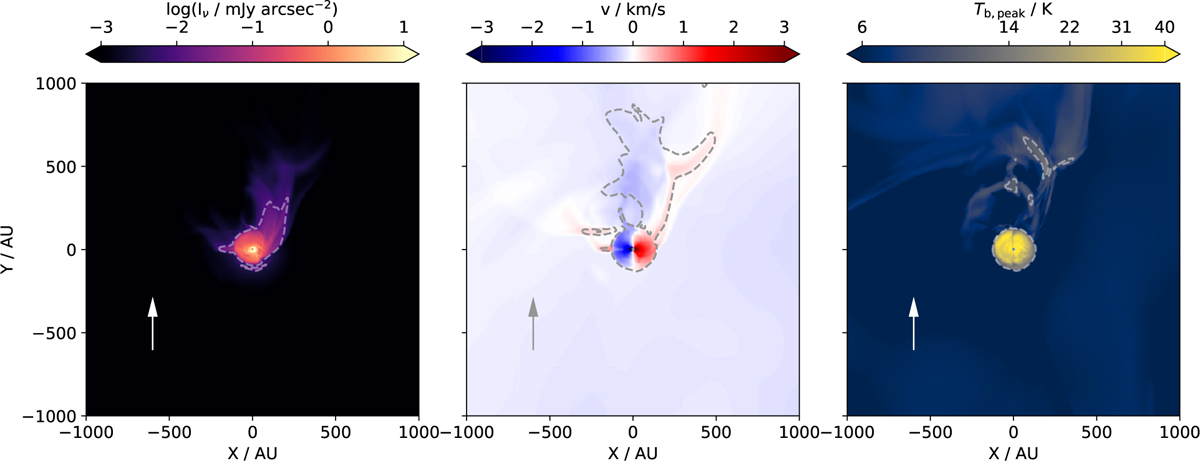
Same as Fig. 6, but for simulation number 2, and the level of the moment 0 contour line was adjusted to 225 mJy arcsec−2 km s−1 to enclose the area of the streamer. Additionally, the color range of the brightness temperature map was adjusted.
Current usage metrics show cumulative count of Article Views (full-text article views including HTML views, PDF and ePub downloads, according to the available data) and Abstracts Views on Vision4Press platform.
Data correspond to usage on the plateform after 2015. The current usage metrics is available 48-96 hours after online publication and is updated daily on week days.
Initial download of the metrics may take a while.