Fig. 10
Download original image
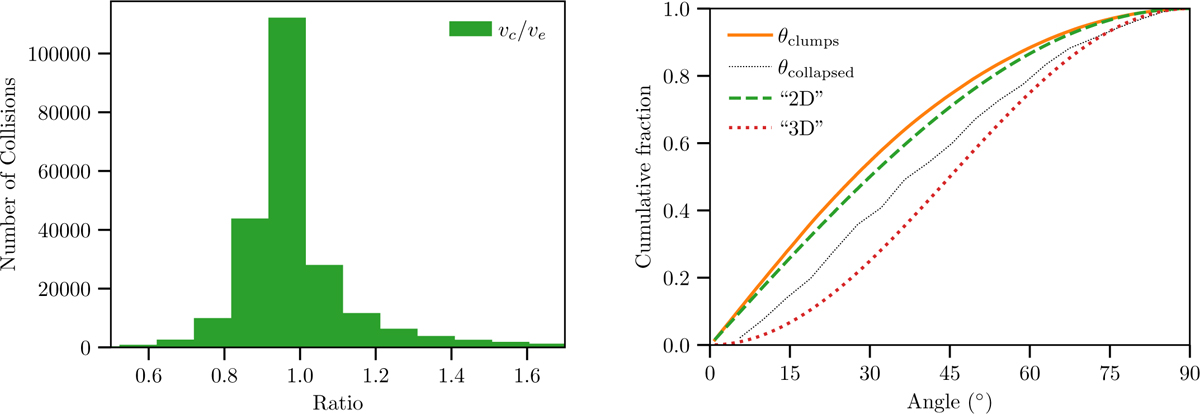
Left: Distribution of the ratio, vc/ve, for all clump-clump (non-collapsed objects only) collisions (see text Sect. 5.9.1) Right: Distribution of the impact angle, θ, for all clump–clump collisions. The solid orange line shows only collisions between clumps, while the thin dotted black lines shows those between collapsed objects. The expected distribution for random orientations (dotted red line) as well as for a flat system (dashed green line) are also shown. Further explanations are given in Sect. 5.9.2.
Current usage metrics show cumulative count of Article Views (full-text article views including HTML views, PDF and ePub downloads, according to the available data) and Abstracts Views on Vision4Press platform.
Data correspond to usage on the plateform after 2015. The current usage metrics is available 48-96 hours after online publication and is updated daily on week days.
Initial download of the metrics may take a while.