Fig. 14
Download original image
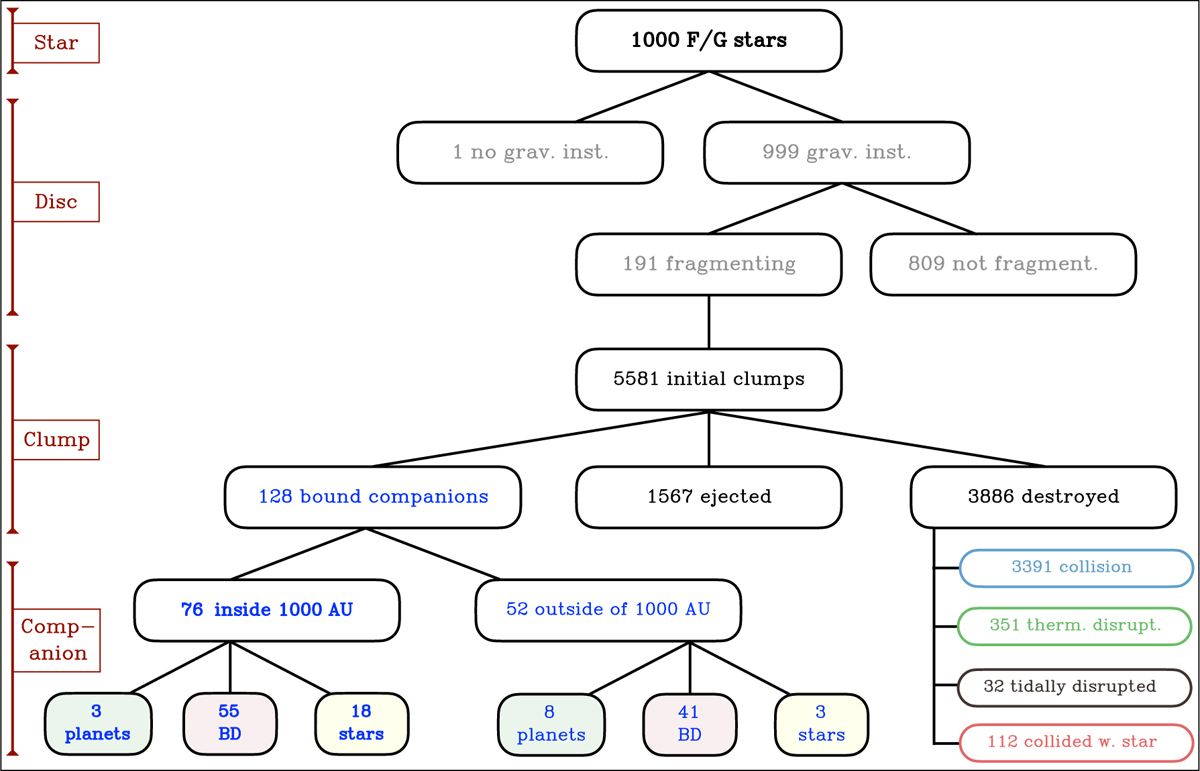
Graphical summary of the results of the baseline population DIPSY-0 for F/G host stars in terms of the frequency of different outcomes. On the left, the basic level (star, disc, clump, and companion) is shown in brown. The rest shows a decision-tree-like flow chart with the different outcomes. The colour coding is taken from Figs. 2 and 1 for the mass ranges of the surviving companions and the fates of the destroyed clumps, respectively. A central outcome, the frequency of bound companions inside of 1000 AU, is shown in blue bold face. Please note that the numbers are subject to model assumptions.
Current usage metrics show cumulative count of Article Views (full-text article views including HTML views, PDF and ePub downloads, according to the available data) and Abstracts Views on Vision4Press platform.
Data correspond to usage on the plateform after 2015. The current usage metrics is available 48-96 hours after online publication and is updated daily on week days.
Initial download of the metrics may take a while.