Open Access
Fig. 4
Download original image
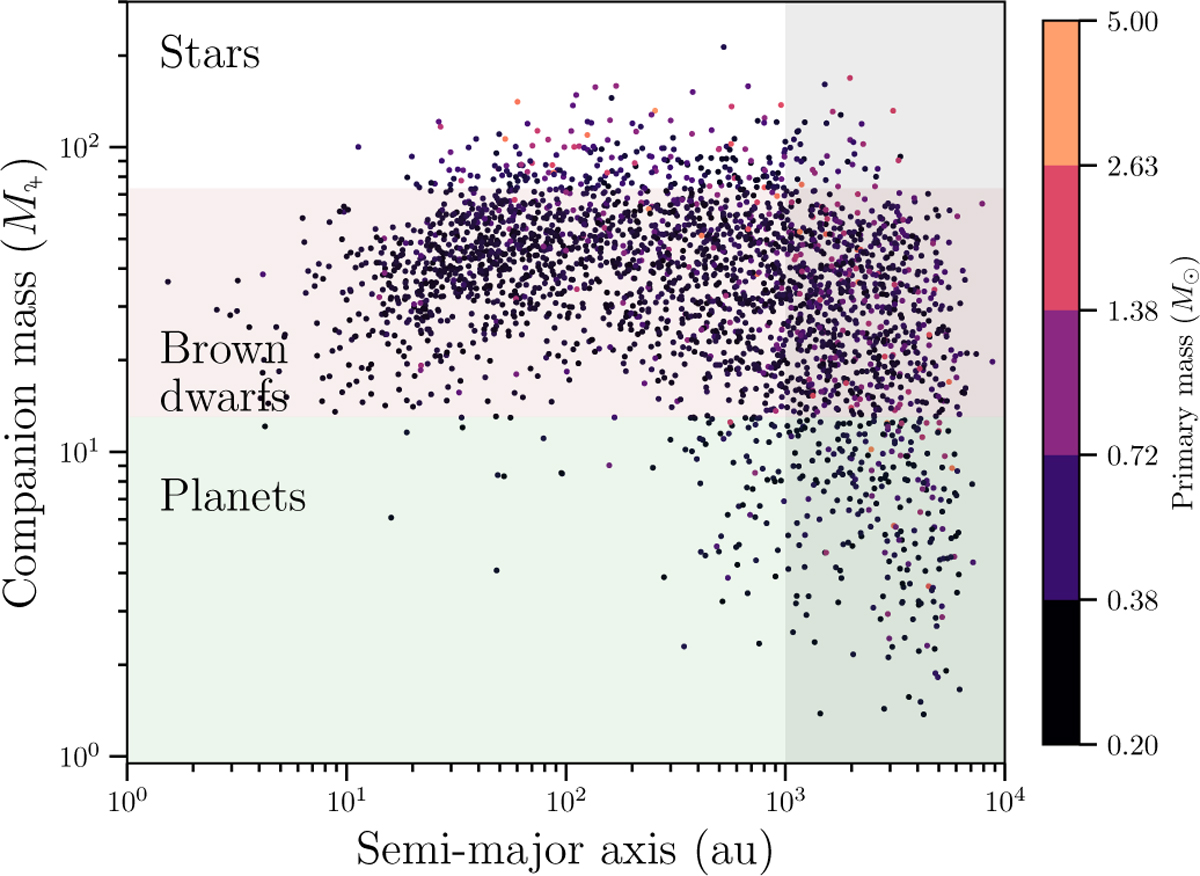
Mass-semi-major axis diagram, weighted according to ξ(log m) (Chabrier-2005 IMF, see text Sect. 5.2.2). With this weighting, the population is completely dominated by M-dwarfs (note the difference in Fig. 2).
Current usage metrics show cumulative count of Article Views (full-text article views including HTML views, PDF and ePub downloads, according to the available data) and Abstracts Views on Vision4Press platform.
Data correspond to usage on the plateform after 2015. The current usage metrics is available 48-96 hours after online publication and is updated daily on week days.
Initial download of the metrics may take a while.