Fig. 9
Download original image
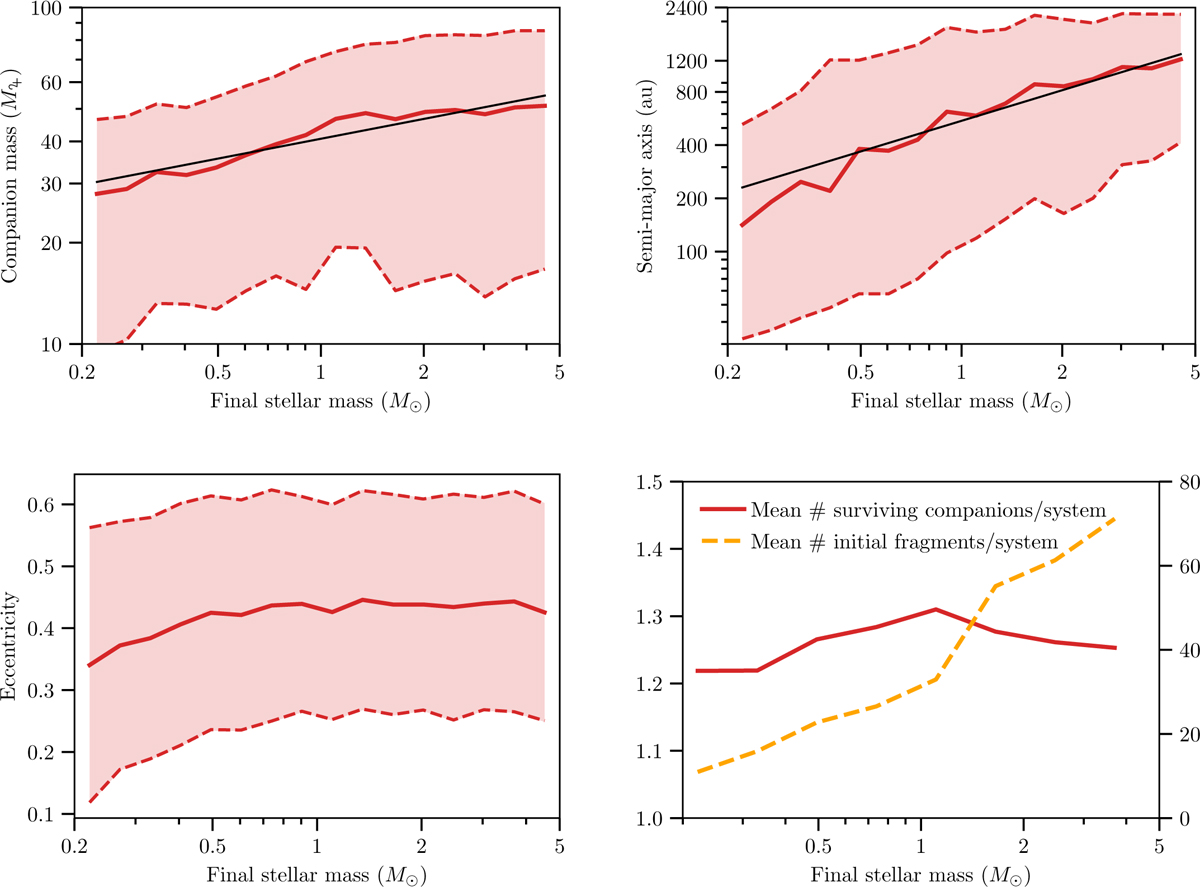
Quantities as a function of M*,final. Top left: Mean final companion mass, Mc. The thin black line shows the best-fit power law. Top right: Median final semi-major axis, Sc. The thin black line shows the best-fitpower law. Bottom left: Mean final eccentricity. Bottom right: Mean number of surviving fragments (left y-axis) per fragmenting system. The mean number of fragments formed initially (i.e. emerging in total during the disc’s lifetime) is shown in orange (right y-axis), also per fragmenting system.
Current usage metrics show cumulative count of Article Views (full-text article views including HTML views, PDF and ePub downloads, according to the available data) and Abstracts Views on Vision4Press platform.
Data correspond to usage on the plateform after 2015. The current usage metrics is available 48-96 hours after online publication and is updated daily on week days.
Initial download of the metrics may take a while.