Fig. 1.
Download original image
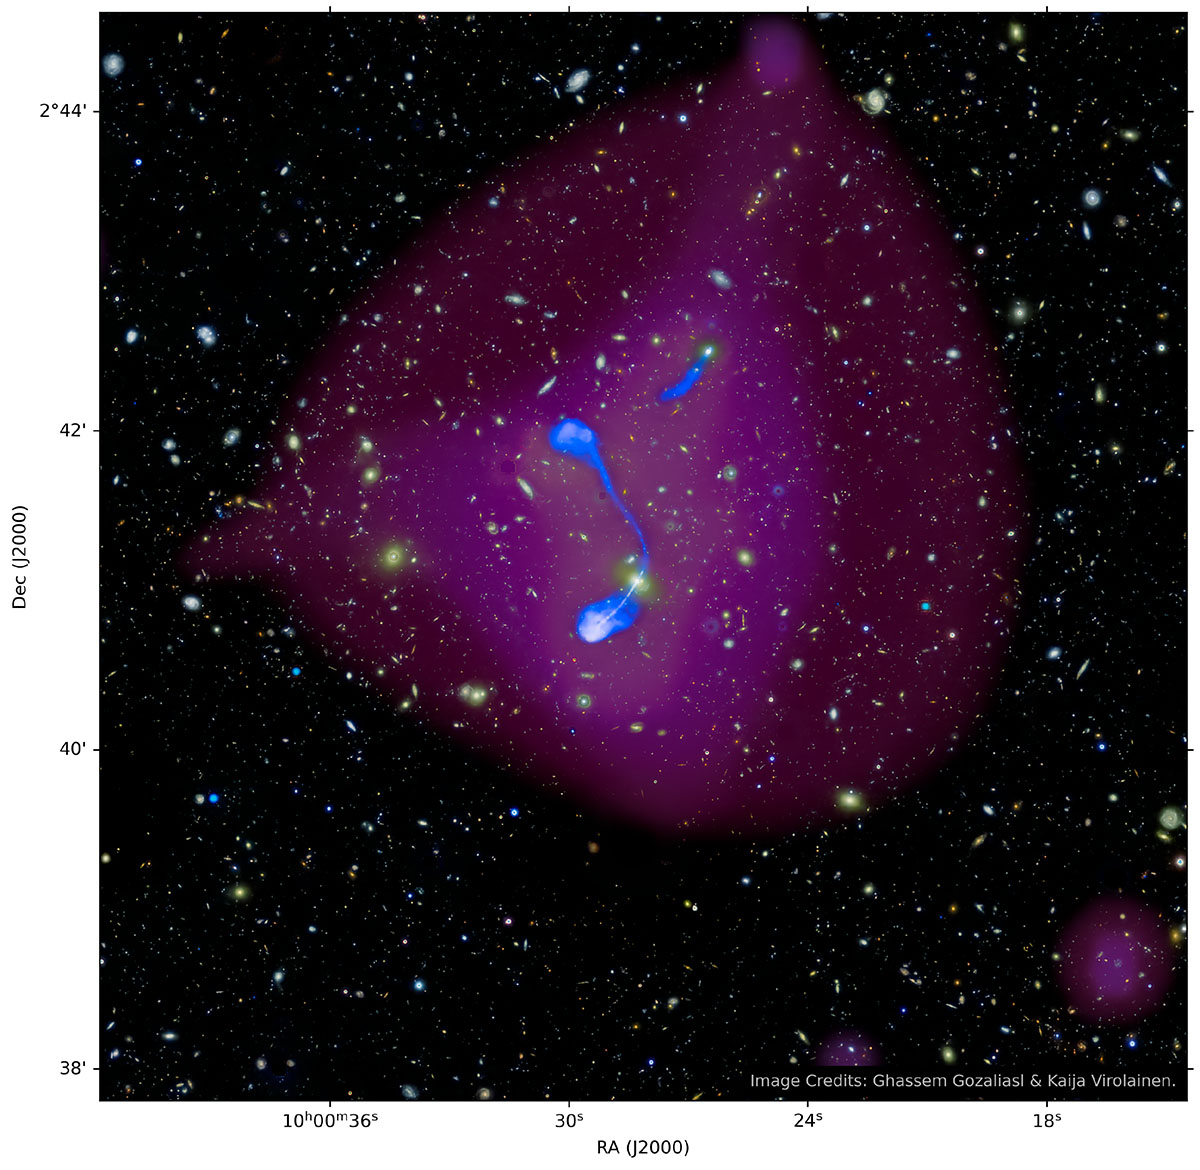
Multiwavelength view of our massive galaxy group in the COSMOS field. The background is an RGB composite created from Subaru i-, r-, and g-band observations (Capak et al. 2008), revealing the optical galaxy distribution. The magenta overlay indicates extended X-ray emission from the intragroup medium, derived from wavelet-filtered 0.5−2 keV data from Chandra and XMM–Newton (see Gozaliasl et al. 2019), tracing diffuse hot gas on scales of 16−256 arcsec. The blue structures highlight the radio emission from the radio galaxies 10913 (WAT, the brightest group galaxy) and 44 (tailed, the second brightest group galaxy), tracing radio jets launched from their central engines. The emission is based on the 3 GHz map from the VLA-COSMOS 3 GHz Large Project (Smolčić et al. 2017a). Together, the image captures the interaction between galaxies, the radio AGNs, and the surrounding hot plasma in a galaxy group at a redshift of z = 0.349.
Current usage metrics show cumulative count of Article Views (full-text article views including HTML views, PDF and ePub downloads, according to the available data) and Abstracts Views on Vision4Press platform.
Data correspond to usage on the plateform after 2015. The current usage metrics is available 48-96 hours after online publication and is updated daily on week days.
Initial download of the metrics may take a while.