Open Access
Fig. 2.
Download original image
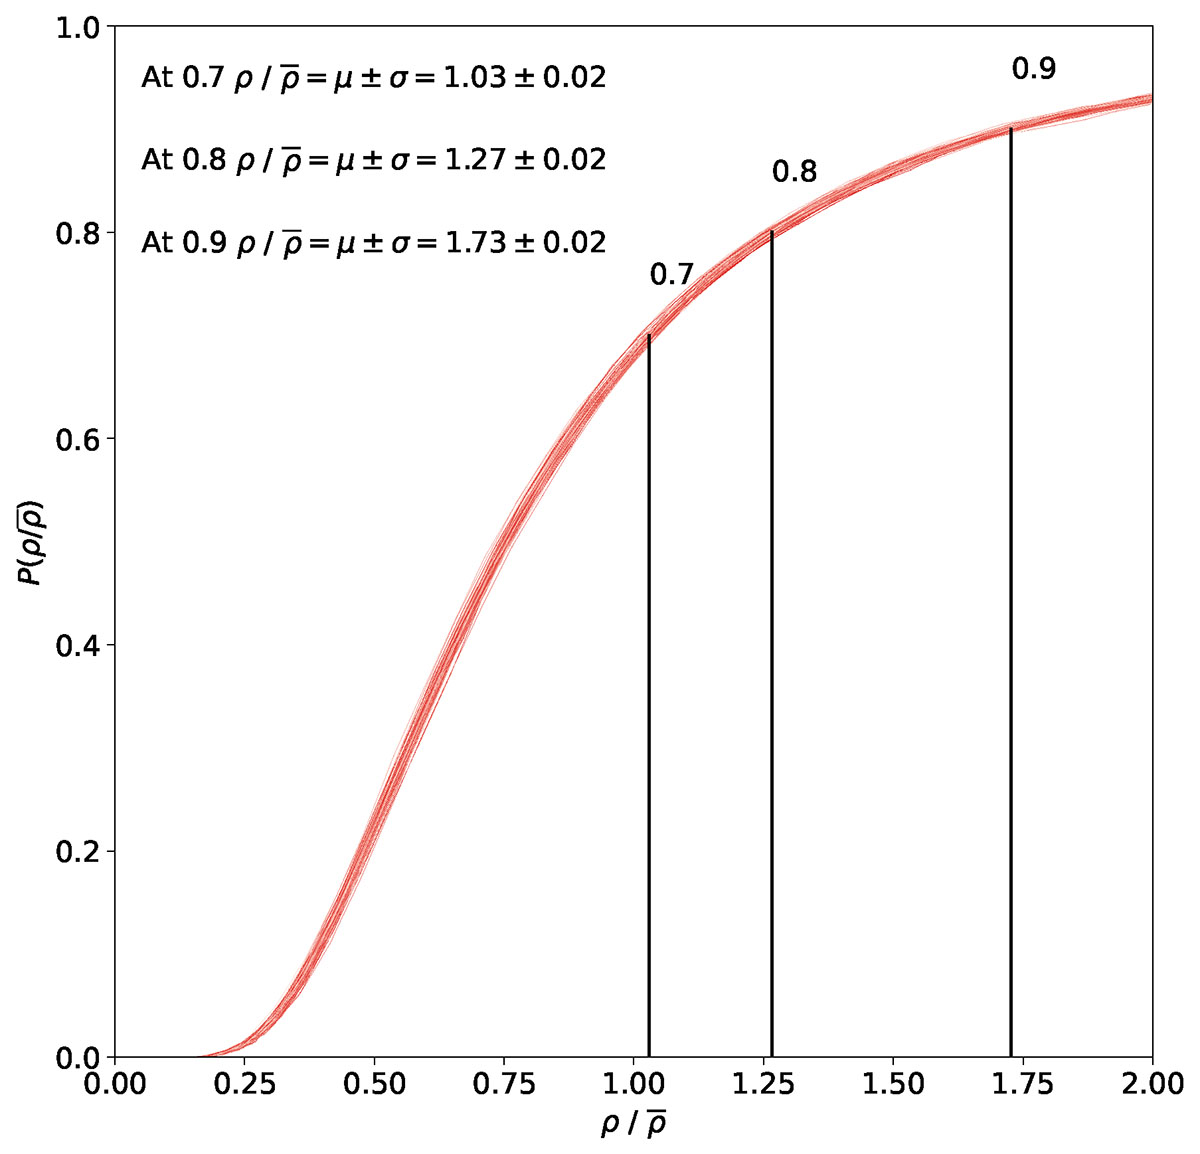
Cumulative distribution functions of the source (galaxy) density scaled with the mean value of source density (for a given sample) for 100 simulated background samples (red curves). Vertical black lines represent the mean density thresholds at P = 0.7, P = 0.8, and P = 0.9 based on 100 simulations.
Current usage metrics show cumulative count of Article Views (full-text article views including HTML views, PDF and ePub downloads, according to the available data) and Abstracts Views on Vision4Press platform.
Data correspond to usage on the plateform after 2015. The current usage metrics is available 48-96 hours after online publication and is updated daily on week days.
Initial download of the metrics may take a while.