Fig. 3.
Download original image
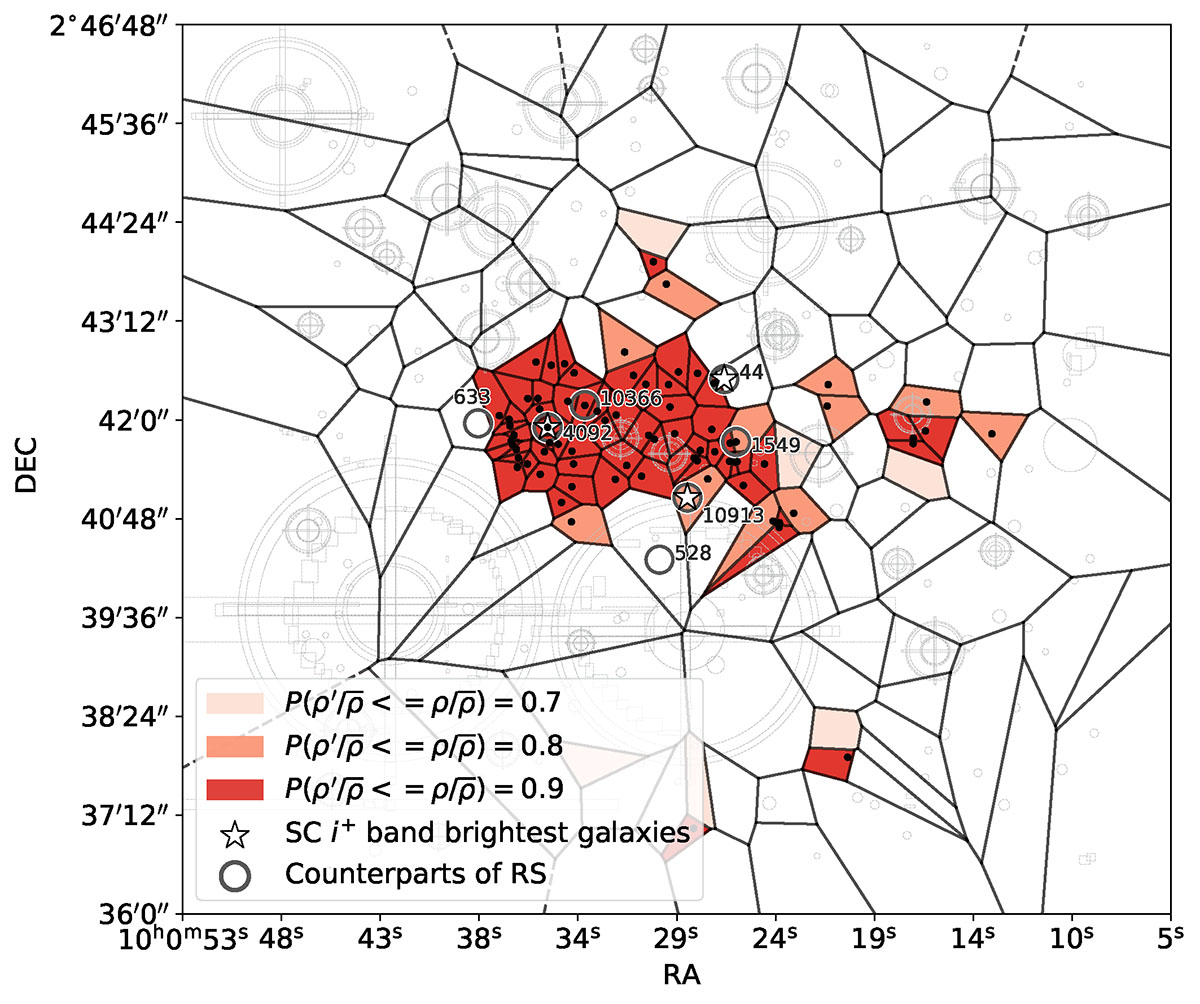
Results of our Voronoi tesselation analysis: Colored cells are left after filtering according to the pre-calculated source density thresholds (0.7, 0.8, and 0.9 in different colors; see Section 4.1 for details). Black dots are galaxies with the local source density higher than 80% of the density values from the total sample, and together with the hosts of radio galaxies 10913 and 44 (manually added, see the text for details) form a sample of probable group members. Host galaxies of the 7 radio sources are shown as open gray circles. 10913, 44, and 4092 correspond to the first, second, and third brightest galaxies of the group, respectively, in the SC i+ band (white stars).
Current usage metrics show cumulative count of Article Views (full-text article views including HTML views, PDF and ePub downloads, according to the available data) and Abstracts Views on Vision4Press platform.
Data correspond to usage on the plateform after 2015. The current usage metrics is available 48-96 hours after online publication and is updated daily on week days.
Initial download of the metrics may take a while.