Fig. 4.
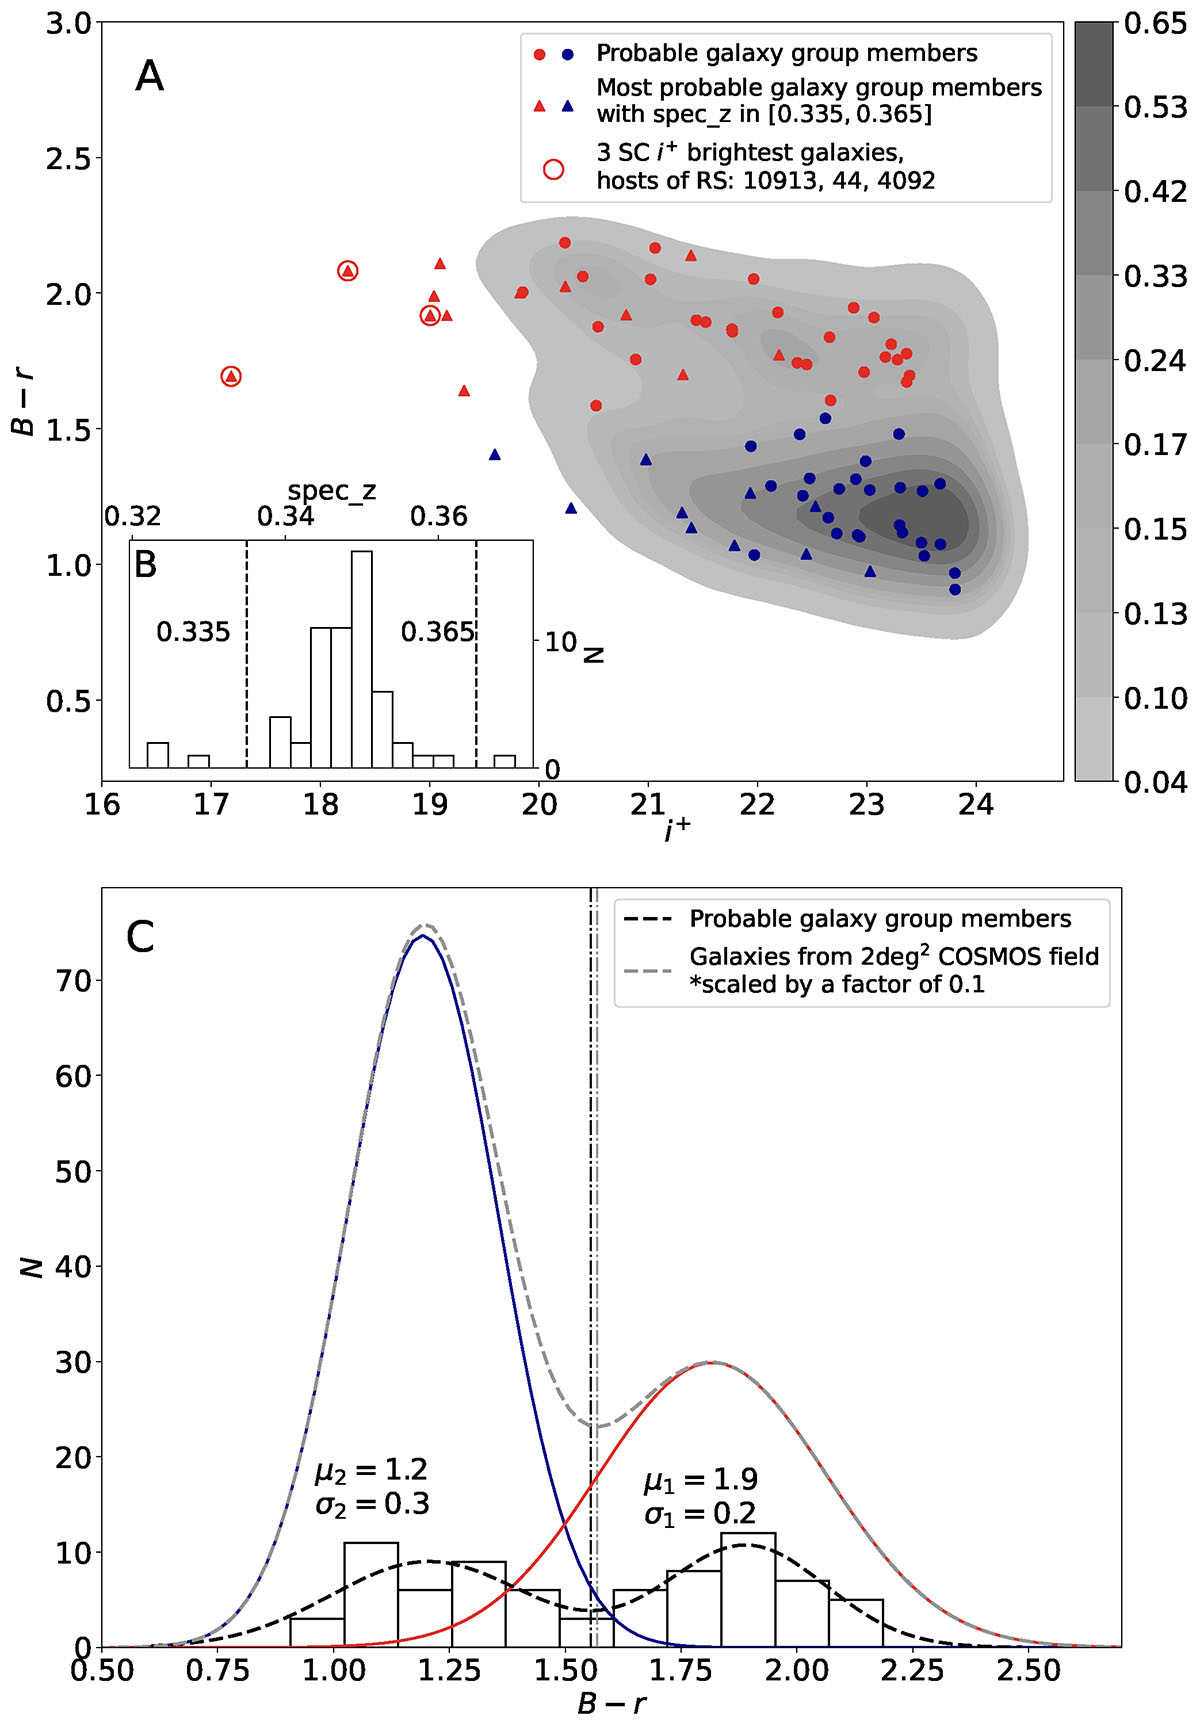
Download original image
Panel A: CMD for 76 probable group members. Triangles represent the 23 most probable members with high-confidence spectroscopic redshifts in a narrow range [0.335, 0.365] centered on the group’s redshift (see panel B, shown as an inset of panel A). Galaxies are separated in blue and red according to color-determination scheme explained in Section 4.2.2. Panel C: 76 probable group galaxies’ bimodal distribution in color compared to the one of the large COSMOS-0.35 sample. Dot-dashed vertical lines indicate the inflection points of the two distributions.
Current usage metrics show cumulative count of Article Views (full-text article views including HTML views, PDF and ePub downloads, according to the available data) and Abstracts Views on Vision4Press platform.
Data correspond to usage on the plateform after 2015. The current usage metrics is available 48-96 hours after online publication and is updated daily on week days.
Initial download of the metrics may take a while.