Fig. 6.
Download original image
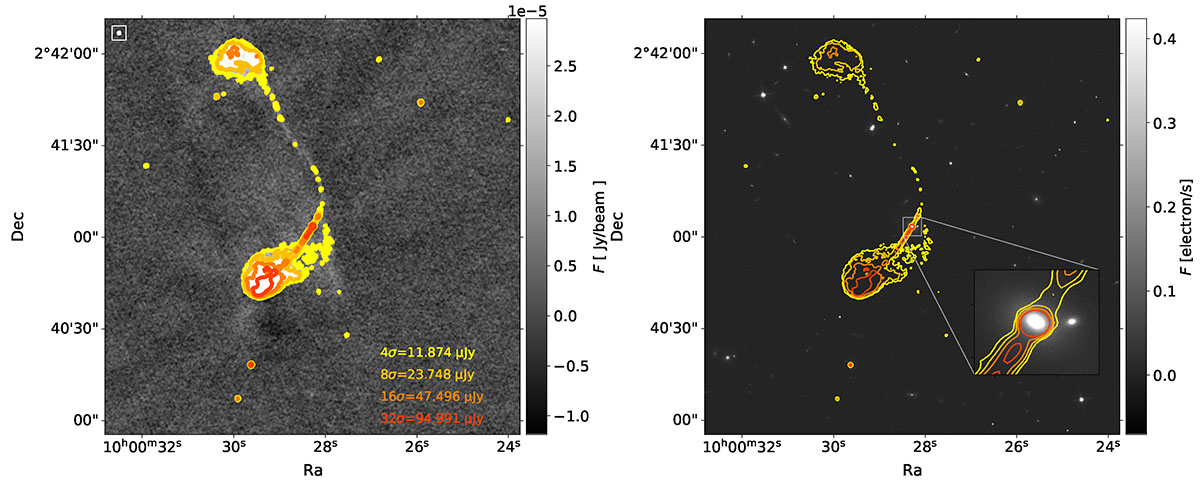
Left: Radio image of WAT radio galaxy 10913 – cutout from 3 GHz map (Smolčić et al. 2017a). Resolution is 0.75″, and the average local rms noise σ = 2.97 μJy/beam. Radio contours are shown and the details on contour levels are given in the bottom right corner while in the upper left corner the corresponding radio beam is shown. Contour levels are set as nσ, while n goes over integer values in logarithmic (log2) scale. The map scale is from −4σ to 10σ. Right: 3 GHz radio contours overlaid on the HST ACS F814W image (host galaxy in optical, Koekemoer et al. 2007).
Current usage metrics show cumulative count of Article Views (full-text article views including HTML views, PDF and ePub downloads, according to the available data) and Abstracts Views on Vision4Press platform.
Data correspond to usage on the plateform after 2015. The current usage metrics is available 48-96 hours after online publication and is updated daily on week days.
Initial download of the metrics may take a while.