Fig. A.3
Download original image
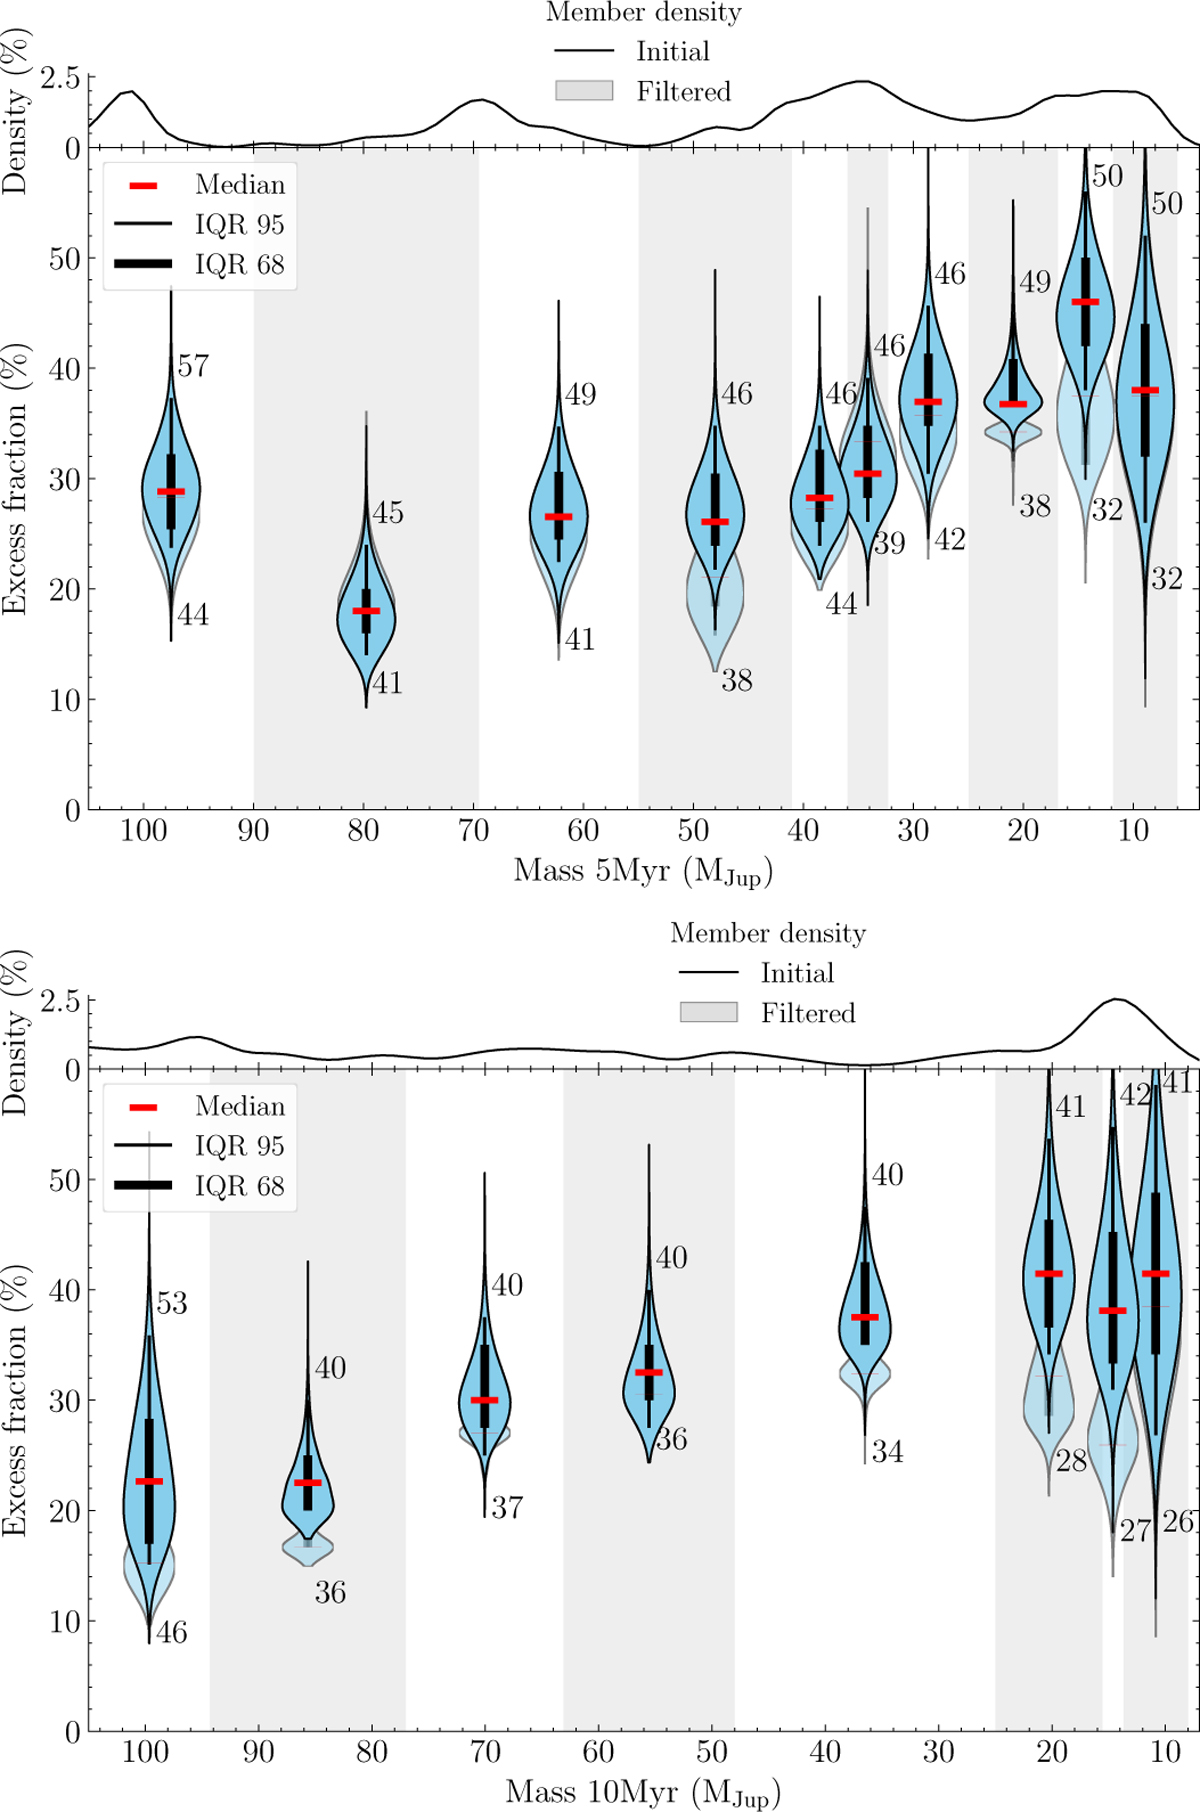
Excess fraction as a function of central object mass for assumed ages of 5 (Top) and 10 Myr (Bottom), over a violin graph of the ![]() distributions and mass density. Same features as Fig. 6 are shown. Linear regression was performed for the entire sample keeping flagged sources in unWISE images (see Sect. 3.1). The original fractions for the cleaned sample are shown in the background with transparency for comparison.
distributions and mass density. Same features as Fig. 6 are shown. Linear regression was performed for the entire sample keeping flagged sources in unWISE images (see Sect. 3.1). The original fractions for the cleaned sample are shown in the background with transparency for comparison.
Current usage metrics show cumulative count of Article Views (full-text article views including HTML views, PDF and ePub downloads, according to the available data) and Abstracts Views on Vision4Press platform.
Data correspond to usage on the plateform after 2015. The current usage metrics is available 48-96 hours after online publication and is updated daily on week days.
Initial download of the metrics may take a while.