Fig. A.4
Download original image
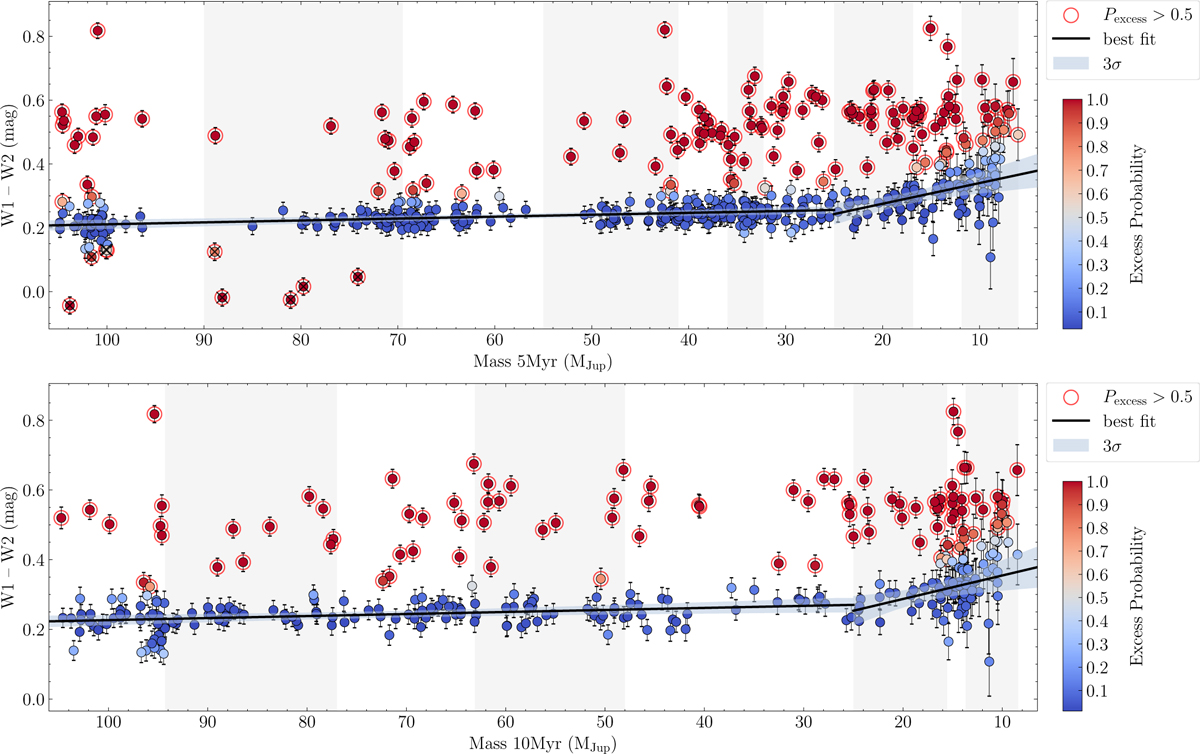
W1–W2 IR color as a function of mass for USC members, assuming ages of 5 (Top) and 10 Myr (Bottom), for the entire sample keeping flagged sources in unWISE images (see Sect. 3.1). The solid black line represents the best-fit relation with outlier rejection applied, while the blue-shaded region corresponds to the 3σ confidence interval of the fit parameters (i.e., slope and intercept). The color scale represents the inferred excess probability, as indicated by the color bar. Red circles highlight sources with an excess probability greater than 0.5. Objects below the fitted photospheric sequence identified as outliers (Pexcess > 0.5) are marked with black crosses, since they are excluded from the subsequent analysis. Background shading is used to delineate mass bins used in Figure A.3.
Current usage metrics show cumulative count of Article Views (full-text article views including HTML views, PDF and ePub downloads, according to the available data) and Abstracts Views on Vision4Press platform.
Data correspond to usage on the plateform after 2015. The current usage metrics is available 48-96 hours after online publication and is updated daily on week days.
Initial download of the metrics may take a while.