Fig. 6
Download original image
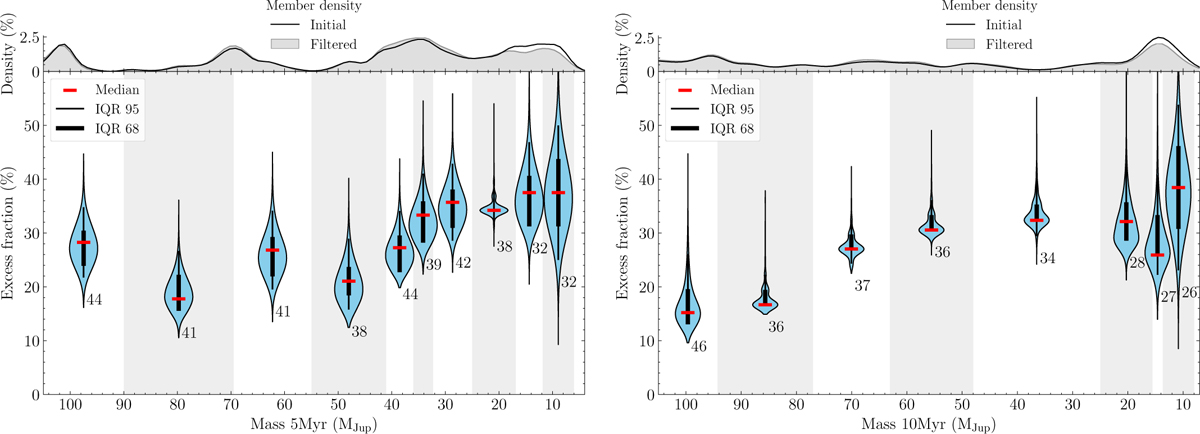
Excess fraction as a function of central object mass for ages 5 (Left) and 10 Myr (Right), over a violin graph of ![]() distributions and mass density. Error bars were obtained from 95% and 68% (or 2 and 3σ respectively) confidence intervals, calculated using the quantiles of the
distributions and mass density. Error bars were obtained from 95% and 68% (or 2 and 3σ respectively) confidence intervals, calculated using the quantiles of the ![]() distributions (see Sect. 3.2). Red dots indicate the median of the distribution, adopted as the disk fraction. The numbers of objects included in each mass bin are indicated. Background shading is used to delineate mass bins. These distributions were obtained by removing the sources flagged in the unWISE images (see Sect. 3.1).
distributions (see Sect. 3.2). Red dots indicate the median of the distribution, adopted as the disk fraction. The numbers of objects included in each mass bin are indicated. Background shading is used to delineate mass bins. These distributions were obtained by removing the sources flagged in the unWISE images (see Sect. 3.1).
Current usage metrics show cumulative count of Article Views (full-text article views including HTML views, PDF and ePub downloads, according to the available data) and Abstracts Views on Vision4Press platform.
Data correspond to usage on the plateform after 2015. The current usage metrics is available 48-96 hours after online publication and is updated daily on week days.
Initial download of the metrics may take a while.