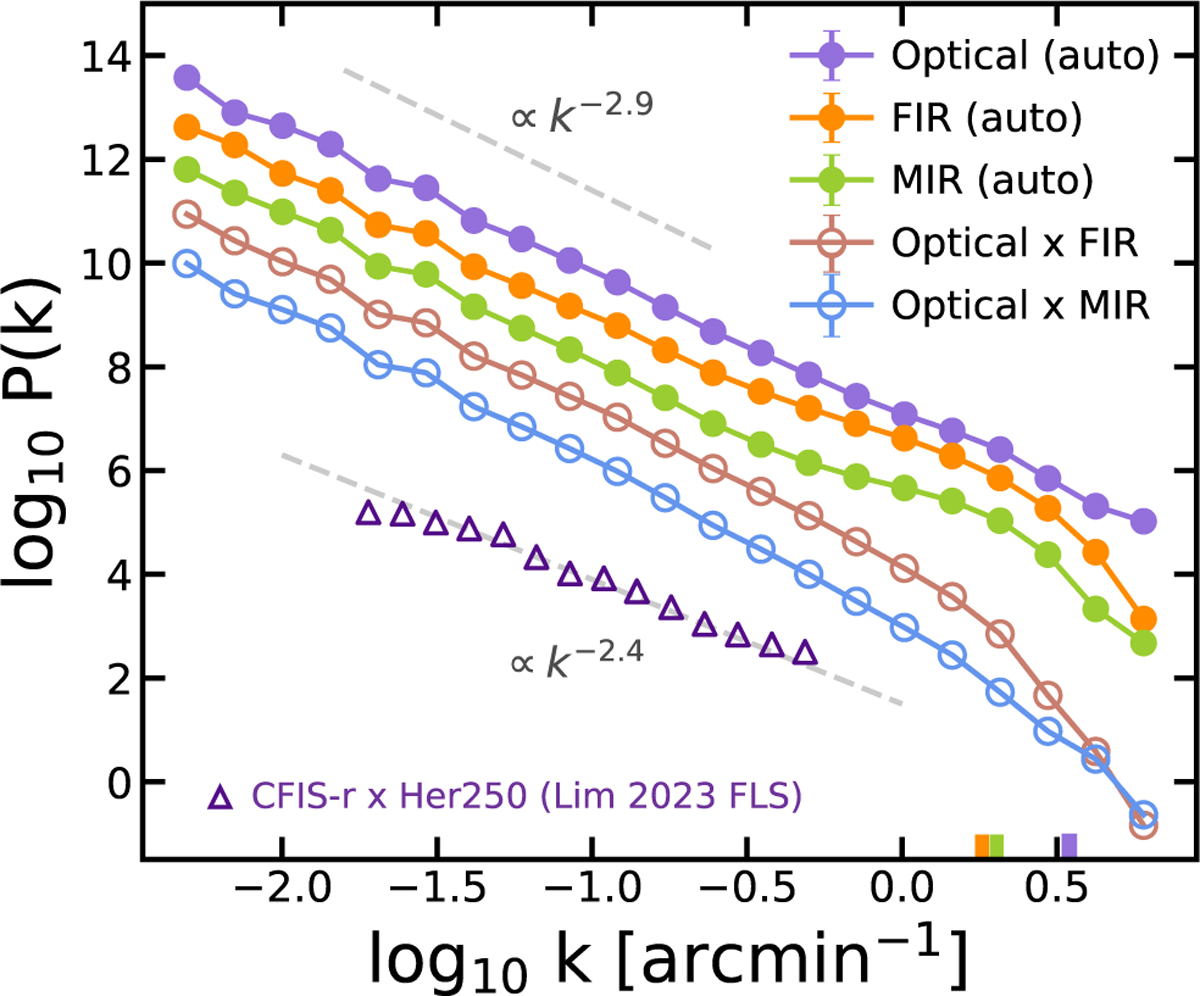
Fig. 10
Download original image
Combined 1D cross-power spectra and power spectra of optical, MIR, and FIR cirrus maps. For visualization, the spectra are vertically offset, with the y-axis in arbitrary units. The colored ticks above the x-axis indicate twice the beam width of each map with the corresponding color. The median error bars are indicated in the upper right for each spectrum. At larger spatial scales (lower k), the cross-power spectra between optical and FIR or MIR follow a power law similar to the auto-power spectra, indicating strong structural correlation. At small scales comparable to or below the beam width, the power actually declines because the non-cirrus systematics are uncorrelated between the maps. Purple triangles show the cross-power spectrum between the CFIS-r image and the Herschel 250 μm image of a cirrus-rich field (“FLS”) measured by Lim et al. (2023) (see text).
Current usage metrics show cumulative count of Article Views (full-text article views including HTML views, PDF and ePub downloads, according to the available data) and Abstracts Views on Vision4Press platform.
Data correspond to usage on the plateform after 2015. The current usage metrics is available 48-96 hours after online publication and is updated daily on week days.
Initial download of the metrics may take a while.