Fig. 13
Download original image
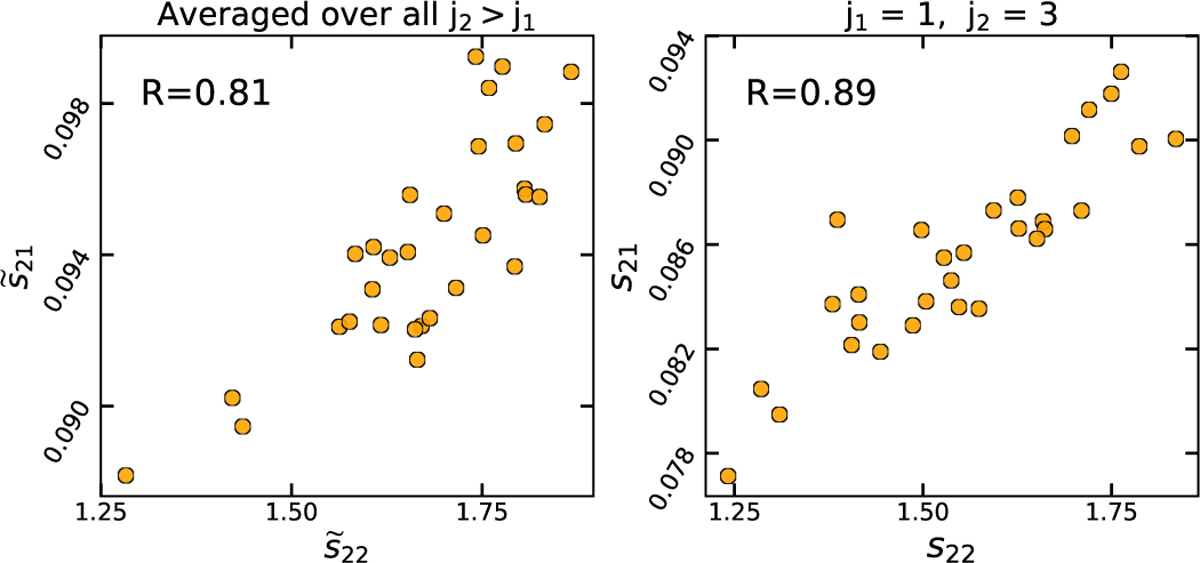
Scatter plot of sparsity vs. linearity for subregions of cirrus in the example Spider field. Each marker represents a subregion within which the statistics have been evaluated. The left panel shows the distribution of reduced statistics, ![]() and
and ![]() , after a weighted average over by all scale combinations with j2 > j1. The right panel shows s21 vs. s22 for one of the combinations with strong correlations (j1 = 1, j2 = 3). In both cases, the sparsity and linearity show strong correlations quantified by high Pearson correlation coefficients. Furthermore, some scale combinations are more relevant than others in describing the continuous changes in cirrus morphology.
, after a weighted average over by all scale combinations with j2 > j1. The right panel shows s21 vs. s22 for one of the combinations with strong correlations (j1 = 1, j2 = 3). In both cases, the sparsity and linearity show strong correlations quantified by high Pearson correlation coefficients. Furthermore, some scale combinations are more relevant than others in describing the continuous changes in cirrus morphology.
Current usage metrics show cumulative count of Article Views (full-text article views including HTML views, PDF and ePub downloads, according to the available data) and Abstracts Views on Vision4Press platform.
Data correspond to usage on the plateform after 2015. The current usage metrics is available 48-96 hours after online publication and is updated daily on week days.
Initial download of the metrics may take a while.