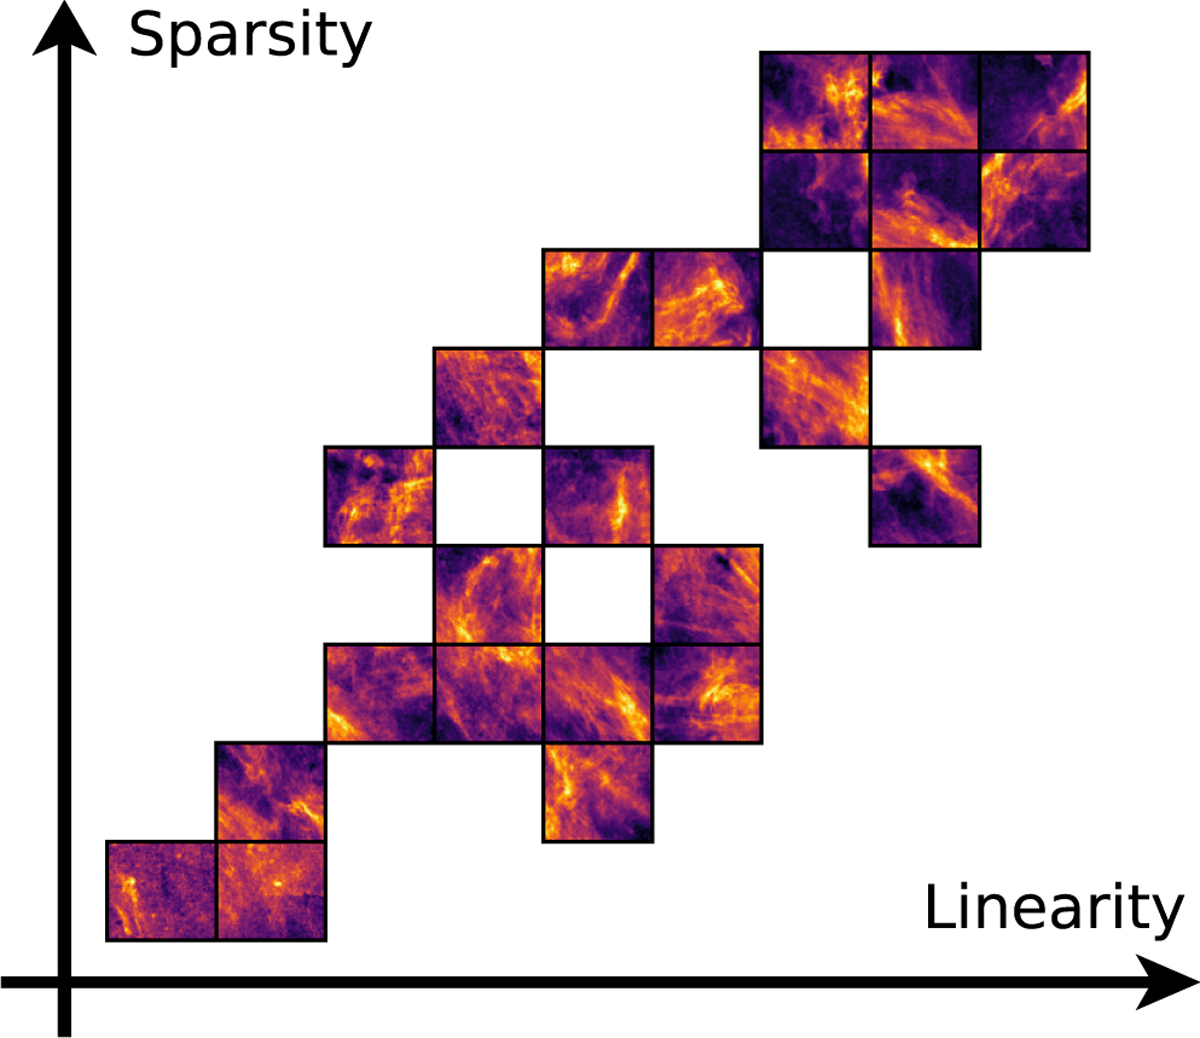
Fig. 14
Download original image
Illustration of sparsity vs. linearity for subregions in the example field showing the cutout images, averaged over by all scale combinations with j2 > j1. Note that the image cutouts are sorted by their positions on the left panel of Fig. 13, so the original layout does not strictly hold. In general, the patterns of the cirrus present a discernible trend varying with the two WST summary statistics, showing a regulation in cirrus morphology.
Current usage metrics show cumulative count of Article Views (full-text article views including HTML views, PDF and ePub downloads, according to the available data) and Abstracts Views on Vision4Press platform.
Data correspond to usage on the plateform after 2015. The current usage metrics is available 48-96 hours after online publication and is updated daily on week days.
Initial download of the metrics may take a while.