Fig. 17
Download original image
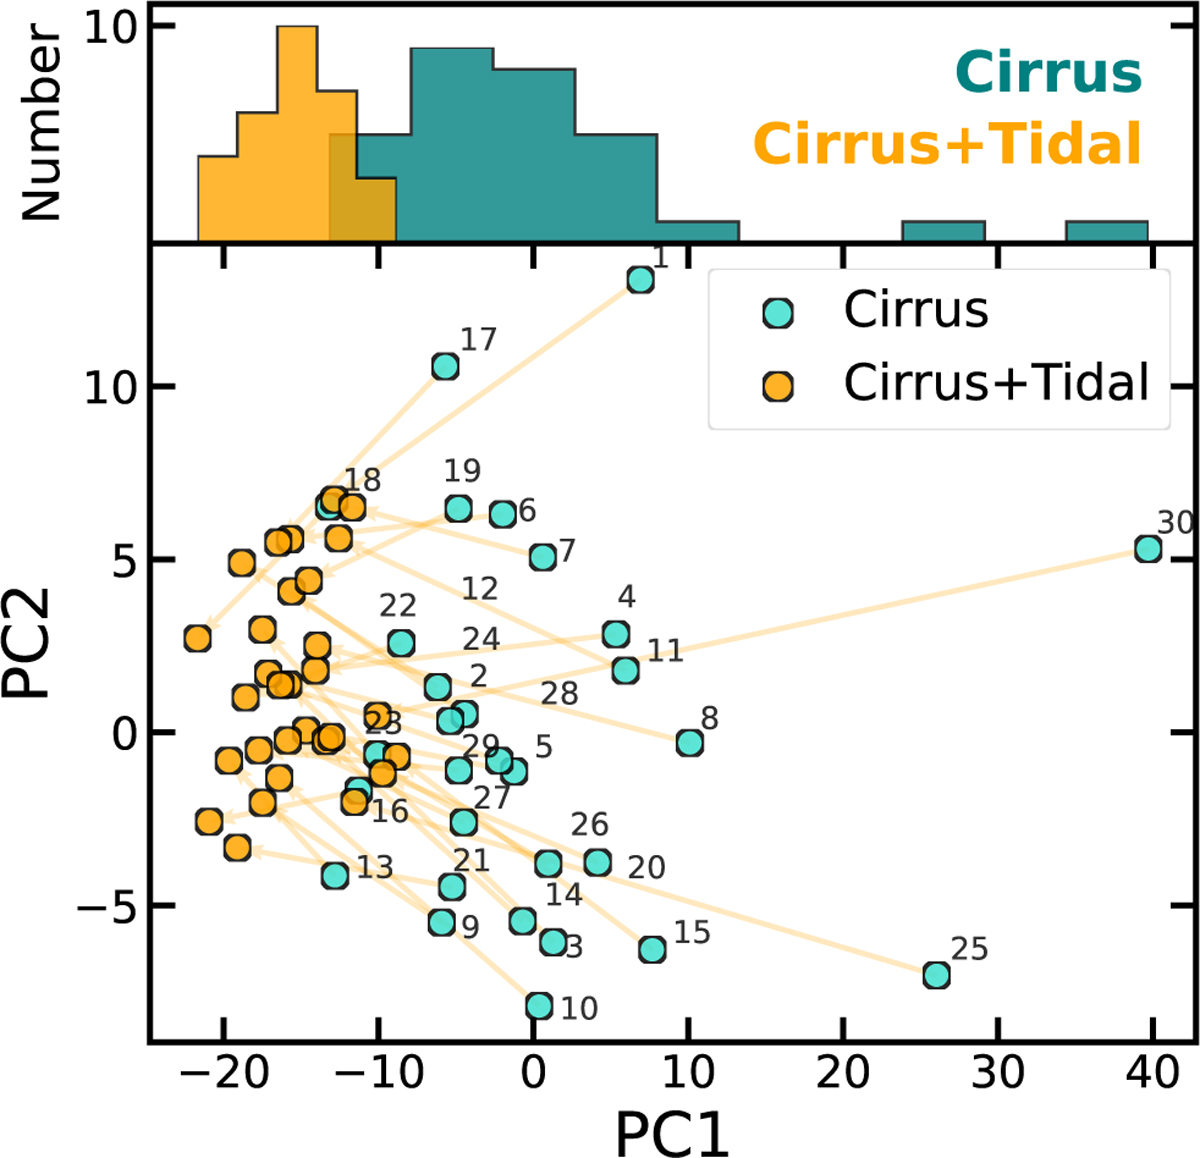
Projection of the WST coefficients onto principal components PC1 and PC2 for subregions with (orange) and without (cyan) tidal tail injection. The top panel shows the histogram with respect to PC1. The PCA is trained with cirrus-only subregions. Even with only one component, the histograms for subregions with and without tidal tails show clustering with different peaks, although there is some overlap. This supports the feasibility of using dimension reduction on WST coefficients to distinguish tidal features from cirrus.
Current usage metrics show cumulative count of Article Views (full-text article views including HTML views, PDF and ePub downloads, according to the available data) and Abstracts Views on Vision4Press platform.
Data correspond to usage on the plateform after 2015. The current usage metrics is available 48-96 hours after online publication and is updated daily on week days.
Initial download of the metrics may take a while.