Fig. 2
Download original image
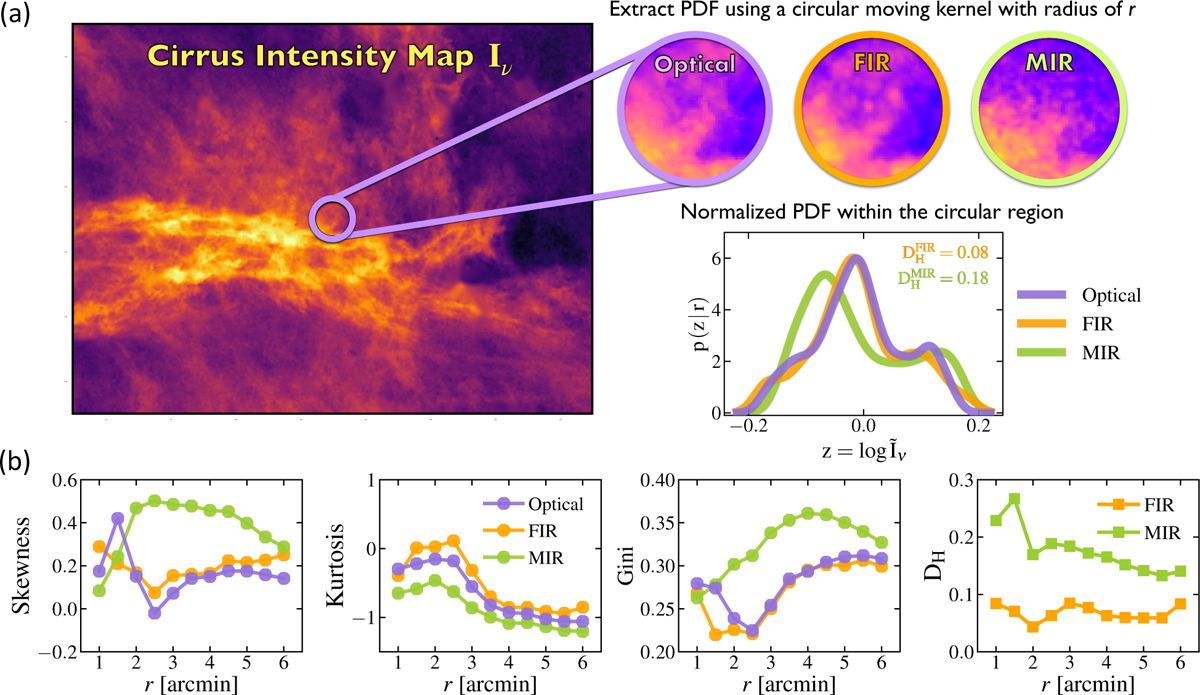
Illustration of the extraction of local PDFs and PDF statistics. (a) Local PDF extracted from the intensity map within a circular region moving across the field. This example shows an extraction with radius of r = 3′ at the same position on the optical (left), FIR (middle), and MIR (right) map. The lower right panel shows the KDE-smoothed PDFs of the logarithm of the normalized intensity in the circular regions (![]() ). The PDFs are used for computing statistics and distance metrics. DH indicates the distance between the PDF of the FIR/MIR data and that of the optical data within the particular subregion. (b) Skewness, kurtosis, and Gini coefficient of the local PDFs at the same position measured on the optical, FIR, and MIR cirrus data with varying kernel radius r. The rightmost panel shows the PDF distance of the FIR and MIR data relative to the optical as a function of kernel radius.
). The PDFs are used for computing statistics and distance metrics. DH indicates the distance between the PDF of the FIR/MIR data and that of the optical data within the particular subregion. (b) Skewness, kurtosis, and Gini coefficient of the local PDFs at the same position measured on the optical, FIR, and MIR cirrus data with varying kernel radius r. The rightmost panel shows the PDF distance of the FIR and MIR data relative to the optical as a function of kernel radius.
Current usage metrics show cumulative count of Article Views (full-text article views including HTML views, PDF and ePub downloads, according to the available data) and Abstracts Views on Vision4Press platform.
Data correspond to usage on the plateform after 2015. The current usage metrics is available 48-96 hours after online publication and is updated daily on week days.
Initial download of the metrics may take a while.