Fig. B.2
Download original image
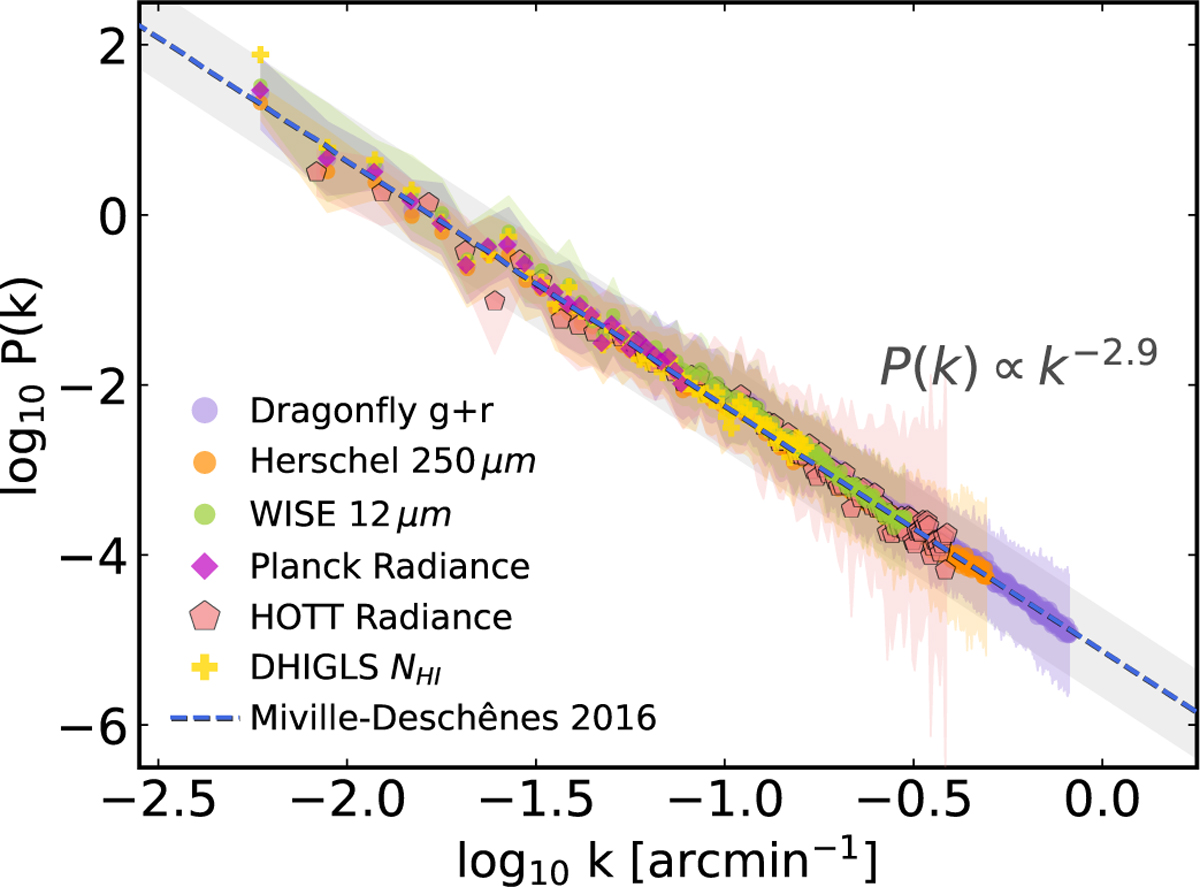
Combined 1D power spectra of different dust tracer maps as Fig 8 added with the result of HOTT radiance map (pink markers). Only the ISM components are shown. The normalization is in arbitrary unit. The power spectrum of the HOTT map follows the same power law as other dust tracers. The larger uncertainties at high frequencies are likely due to the CIBA.
Current usage metrics show cumulative count of Article Views (full-text article views including HTML views, PDF and ePub downloads, according to the available data) and Abstracts Views on Vision4Press platform.
Data correspond to usage on the plateform after 2015. The current usage metrics is available 48-96 hours after online publication and is updated daily on week days.
Initial download of the metrics may take a while.