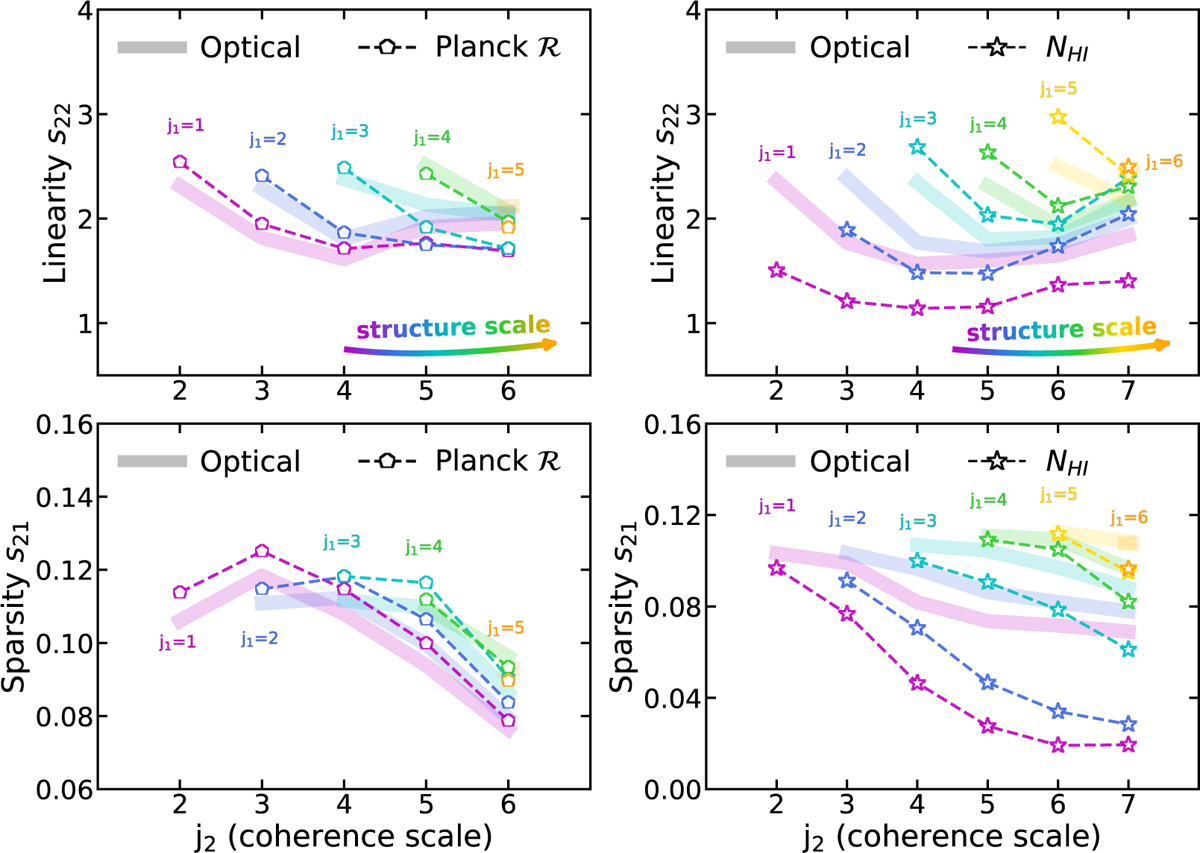
Fig. C.1
Download original image
WST statistics of Planck radiance map (left column) and DHIGLS NH I map (right column) compared to those computed using the optical map with matched beam widths. The x-axis describes the coherence scale j2. The structure scale is color-coded by j1. Only j2 > j1 ≥ 1 terms are shown because j1 = 0 structures are significantly smaller than the beams and j2 ≤ j1 terms are dependent on the wavelets. In general, s22 and s21 of Planck follow similar trends with those of optical, except for s22 at large coherence scales. However, H I shows deviation from the optical, which could be caused by different processing of H I data and possibly indicate the decoupling between gas and dust.
Current usage metrics show cumulative count of Article Views (full-text article views including HTML views, PDF and ePub downloads, according to the available data) and Abstracts Views on Vision4Press platform.
Data correspond to usage on the plateform after 2015. The current usage metrics is available 48-96 hours after online publication and is updated daily on week days.
Initial download of the metrics may take a while.