Fig. C.3
Download original image
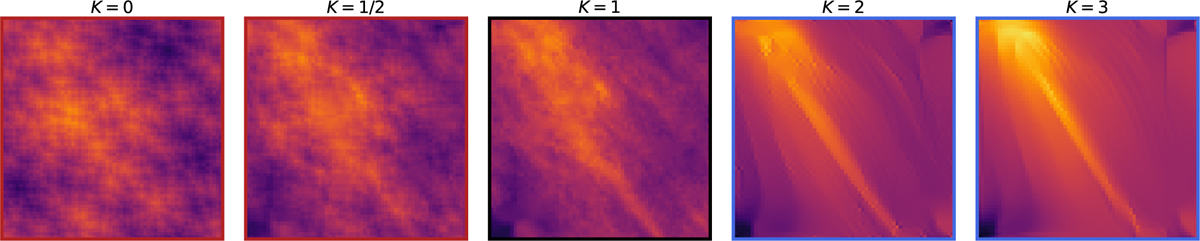
Illustration of the morphological variation of cirrus structures by artificially increasing or decreasing scattering coefficients. The third panel is a 25′ × 25′ cutout of the optical cirrus map in the example dataset, which is used as the base image. The amplitudes of scattering covariance C01 and C11 are scaled by a factor K that is reduced in the left two panels and increased in the right two panels. From left to right, the sparsity and linearity of the field increase.
Current usage metrics show cumulative count of Article Views (full-text article views including HTML views, PDF and ePub downloads, according to the available data) and Abstracts Views on Vision4Press platform.
Data correspond to usage on the plateform after 2015. The current usage metrics is available 48-96 hours after online publication and is updated daily on week days.
Initial download of the metrics may take a while.