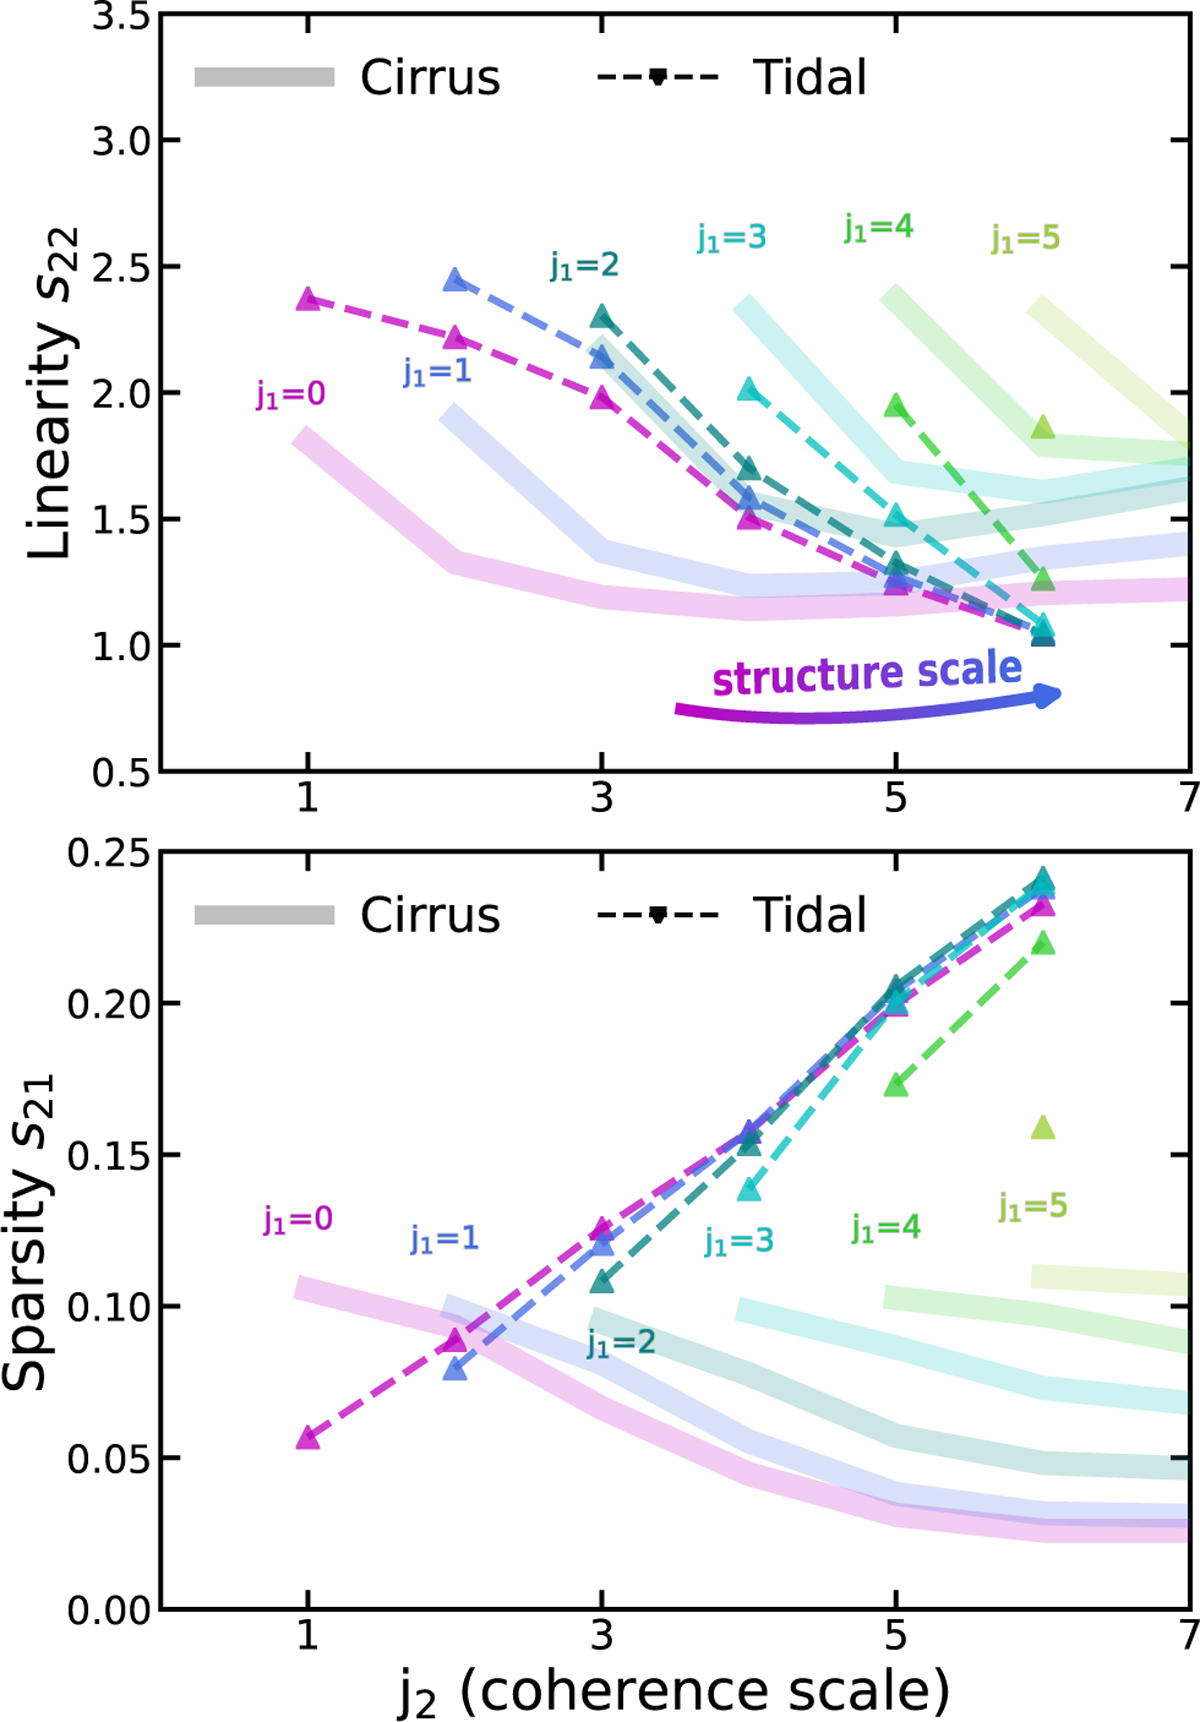
Fig. D.1
Download original image
WST summary statistics of the simulated tidal features (dashed lines) compared to results of optical cirrus shown in Fig. 12. From small to large coherence scales, s22 of tidal features consistently decreases, while s21 shows opposite trends. Note that the range of the y-axis of s21 here is larger than that in Fig. 12. The results here quantify the differences in the morphology of optical Galactic cirrus and tidal features, which lead to their differentiation shown in Figs. 17 and 18.
Current usage metrics show cumulative count of Article Views (full-text article views including HTML views, PDF and ePub downloads, according to the available data) and Abstracts Views on Vision4Press platform.
Data correspond to usage on the plateform after 2015. The current usage metrics is available 48-96 hours after online publication and is updated daily on week days.
Initial download of the metrics may take a while.