Open Access
Fig. 4
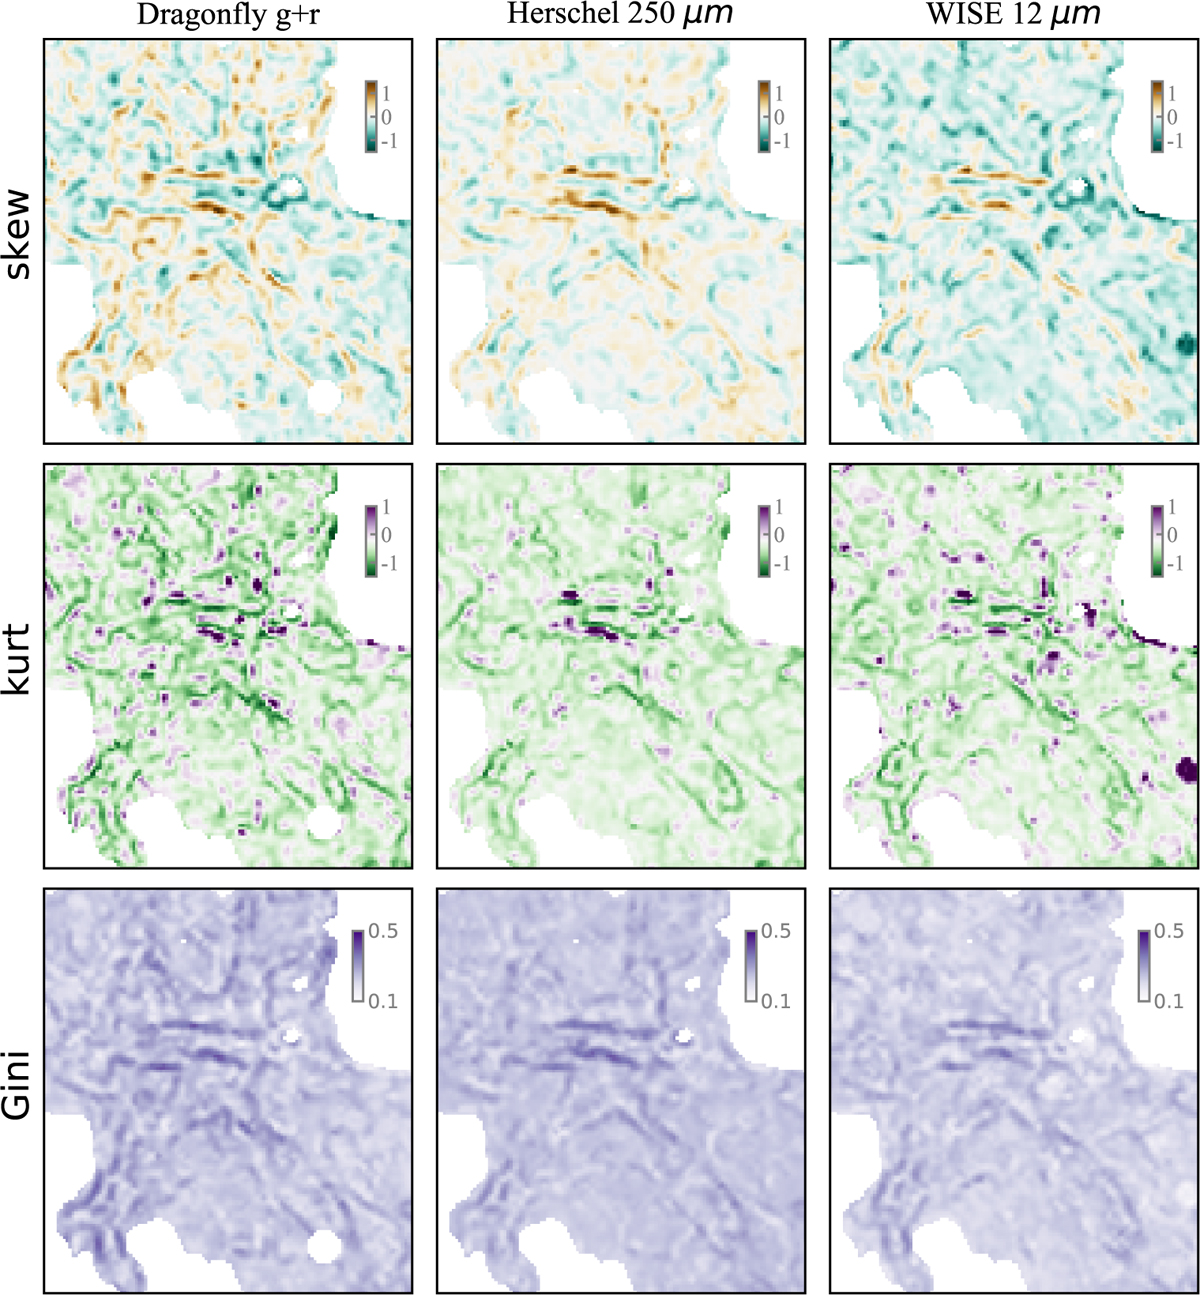
Download original image
Spatial distributions of local skewness, kurtosis, and Gini extracted from the Dragonfly optical (left column), Herschel FIR (middle column), and WISE MIR (right column) data, using a moving circular kernel with a kernel width of dk = 10′. These maps trace where cirrus morphology changes.
Current usage metrics show cumulative count of Article Views (full-text article views including HTML views, PDF and ePub downloads, according to the available data) and Abstracts Views on Vision4Press platform.
Data correspond to usage on the plateform after 2015. The current usage metrics is available 48-96 hours after online publication and is updated daily on week days.
Initial download of the metrics may take a while.