Fig. 5
Download original image
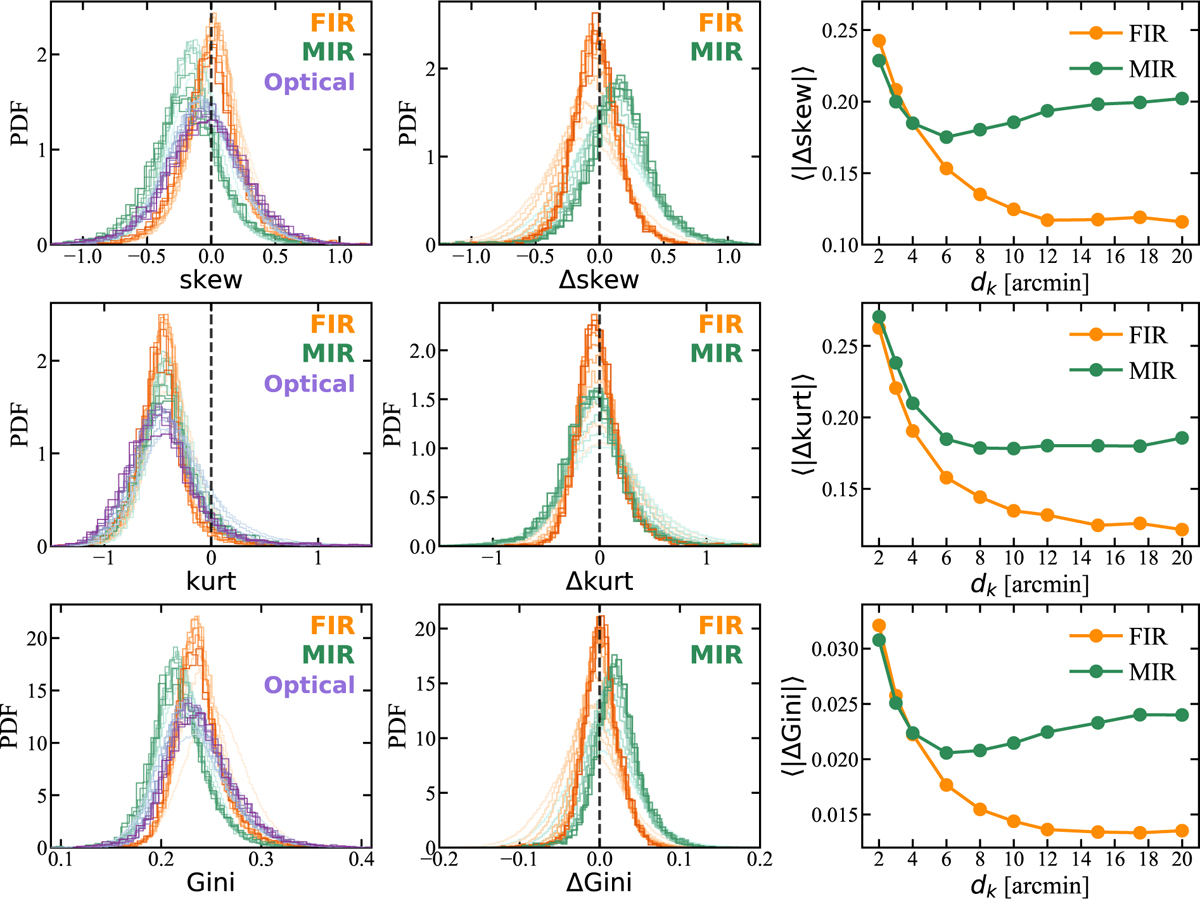
Left column: histograms of skewness, kurtosis, and Gini measured from the local PDFs in optical, FIR, and MIR data. Fainter histograms represent smaller kernel scales used for PDF extraction. Middle column: histograms showing the distributions of differences of the statistics between FIR or MIR and optical data. The difference is calculated by [optical-X], where X stands for the band. Right column: mean absolute difference of statistics between FIR or MIR and optical as a function of kernel scale.
Current usage metrics show cumulative count of Article Views (full-text article views including HTML views, PDF and ePub downloads, according to the available data) and Abstracts Views on Vision4Press platform.
Data correspond to usage on the plateform after 2015. The current usage metrics is available 48-96 hours after online publication and is updated daily on week days.
Initial download of the metrics may take a while.