Fig. 6
Download original image
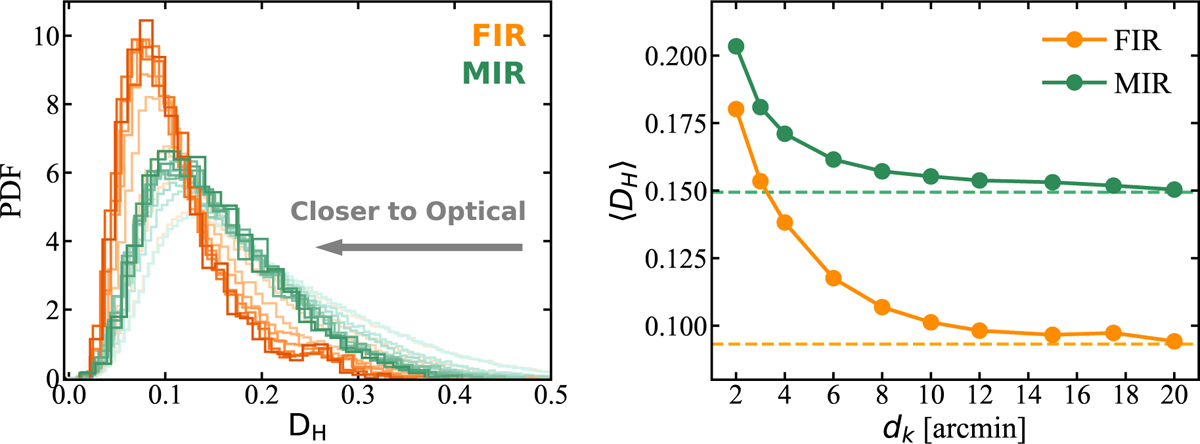
Left: histograms of the Hellinger distance (DH) between FIR or MIR and optical maps, which indicates the proximity of two cirrus maps. Smaller DH represents a closer local PDF. Histograms with lighter shades represent smaller kernel scales used for the PDF extraction. The PDF distance of FIR relative to optical is systematically lower than that of MIR. The dispersion is also much smaller. Right: mean DH between FIR (orange) or MIR (green) and optical data as a function of kernel scale. The mean DH of FIR relative to optical is lower than MIR in all scales. The dashed lines show the asymptotic values at large scales.
Current usage metrics show cumulative count of Article Views (full-text article views including HTML views, PDF and ePub downloads, according to the available data) and Abstracts Views on Vision4Press platform.
Data correspond to usage on the plateform after 2015. The current usage metrics is available 48-96 hours after online publication and is updated daily on week days.
Initial download of the metrics may take a while.