Fig. 7
Download original image
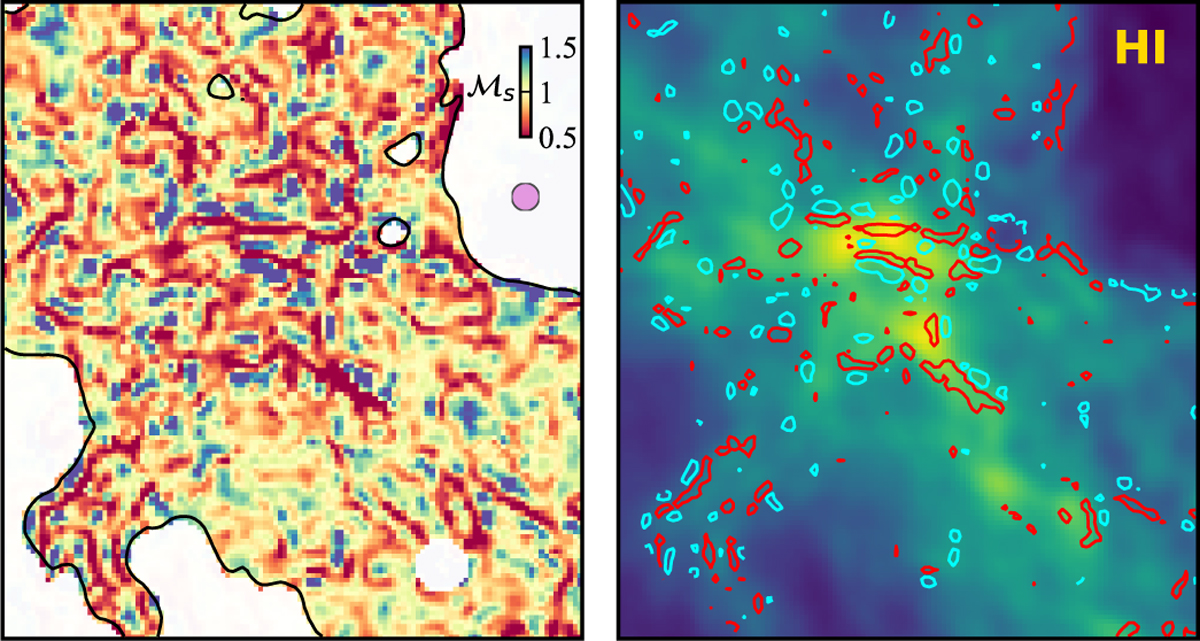
Left: maps of sonic Mach number inferred from optical cirrus map illustrated with a kernel scale of dk = 10′. The circular kernel is illustrated with the purple disk. Right: mean H I column density fields extracted with the same kernel in the upper panels. Regions with ℳs < 0.5 and > 1.5 in the upper panels are indicated by red and cyan contours, respectively, which aggregate at edges of cirrus filaments or patches.
Current usage metrics show cumulative count of Article Views (full-text article views including HTML views, PDF and ePub downloads, according to the available data) and Abstracts Views on Vision4Press platform.
Data correspond to usage on the plateform after 2015. The current usage metrics is available 48-96 hours after online publication and is updated daily on week days.
Initial download of the metrics may take a while.