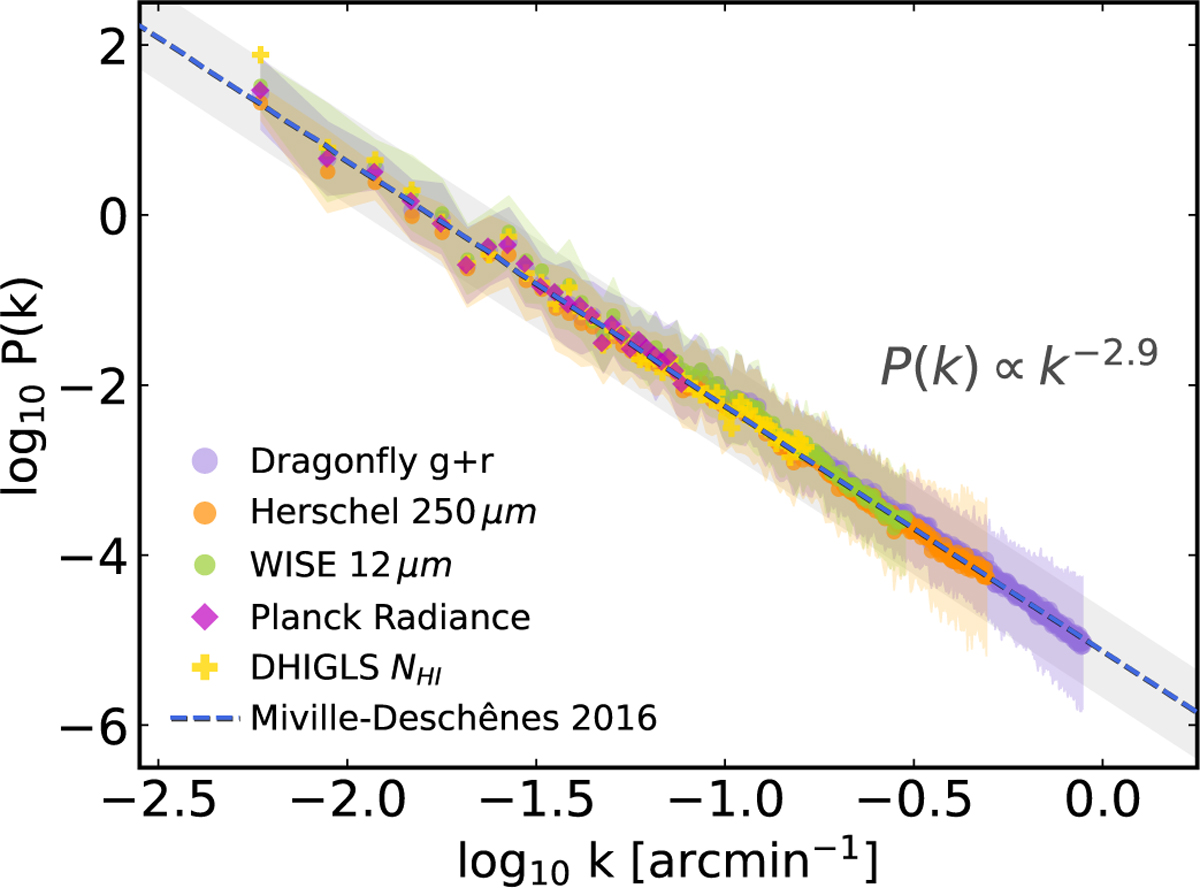
Fig. 8
Download original image
Combined 1D power spectra of different dust/gas tracer maps. We only show the ISM components of the power spectra, i.e., the contaminating sky noise and instrumental noise components are subtracted. The power spectra from different maps are similar, with a power index of γ ranging from −2.8 to −3.0 (Table 3). Each power spectrum is displayed for a conservative range at higher k, excluding where the contaminating noise is most prominent and/or the cutoff by the beam is significant. The normalization is in arbitrary units, with the power-laws being aligned in the range where they overlap at lower k. The power spectra are overplotted in order of increasing beam size (except FIR and MIR, guided by Fig. 10), so that it can be appreciated that the spectrum for the Dragonfly optical (g+r) map extends to the highest k. The dashed blue line shows the result of Miville-Deschênes et al. (2016) with P(k) ∝ k−2.9.
Current usage metrics show cumulative count of Article Views (full-text article views including HTML views, PDF and ePub downloads, according to the available data) and Abstracts Views on Vision4Press platform.
Data correspond to usage on the plateform after 2015. The current usage metrics is available 48-96 hours after online publication and is updated daily on week days.
Initial download of the metrics may take a while.