Fig. 9
Download original image
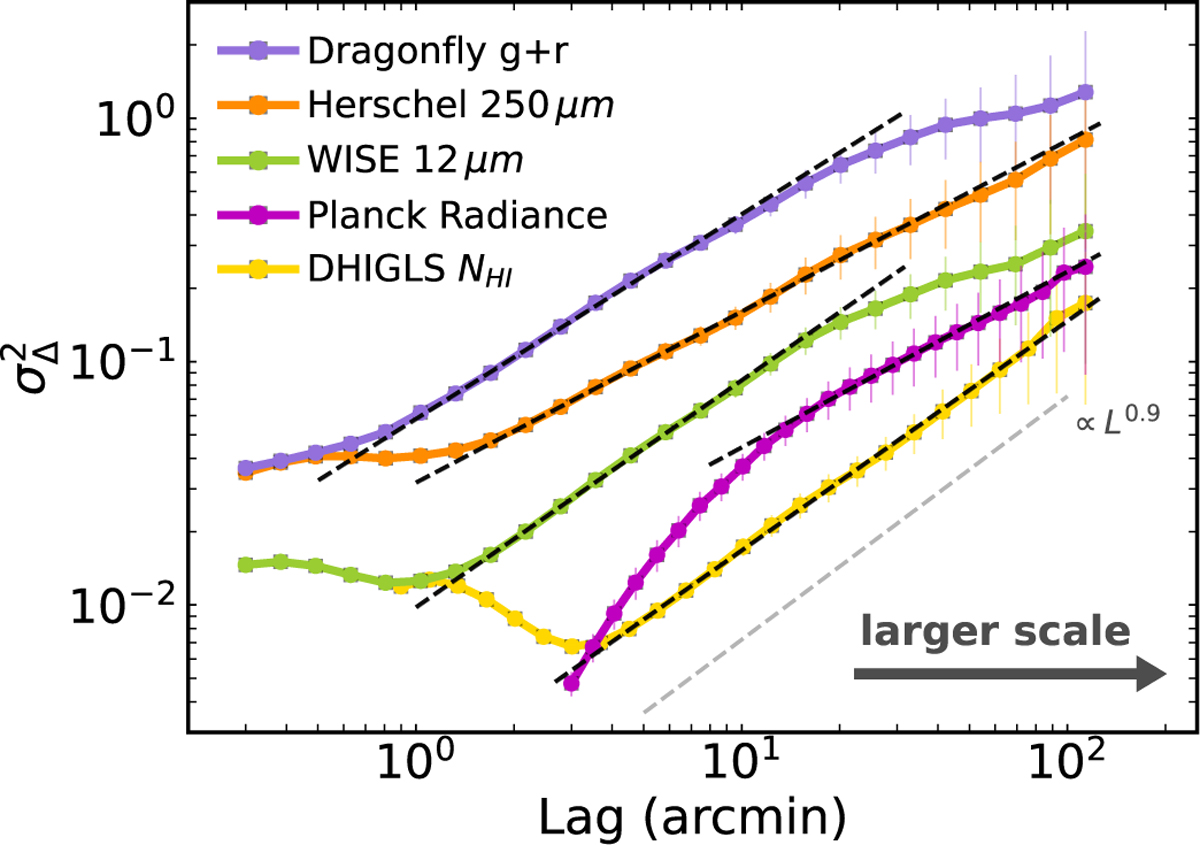
Δ-variance spectra of different dust tracer maps. The “lag” (L) corresponds to the structure scale and ![]() quantifies the variance of density fluctuations. WISE, Planck, and H I results are multiplied by a factor of 104, 5, and 5 × 10⁻³, respectively, for this visualization. A similar coherence, characterized by a power-law scaling
quantifies the variance of density fluctuations. WISE, Planck, and H I results are multiplied by a factor of 104, 5, and 5 × 10⁻³, respectively, for this visualization. A similar coherence, characterized by a power-law scaling ![]() ∝ Lα, is revealed by the different dust tracers over a wide range of scales. A linear model is fit (dashed black lines) to find the slope, in the range α = 0.7–1. At very small and large scales, the coherence is altered by map-specific systematics.
∝ Lα, is revealed by the different dust tracers over a wide range of scales. A linear model is fit (dashed black lines) to find the slope, in the range α = 0.7–1. At very small and large scales, the coherence is altered by map-specific systematics.
Current usage metrics show cumulative count of Article Views (full-text article views including HTML views, PDF and ePub downloads, according to the available data) and Abstracts Views on Vision4Press platform.
Data correspond to usage on the plateform after 2015. The current usage metrics is available 48-96 hours after online publication and is updated daily on week days.
Initial download of the metrics may take a while.