Fig. 8
Download original image
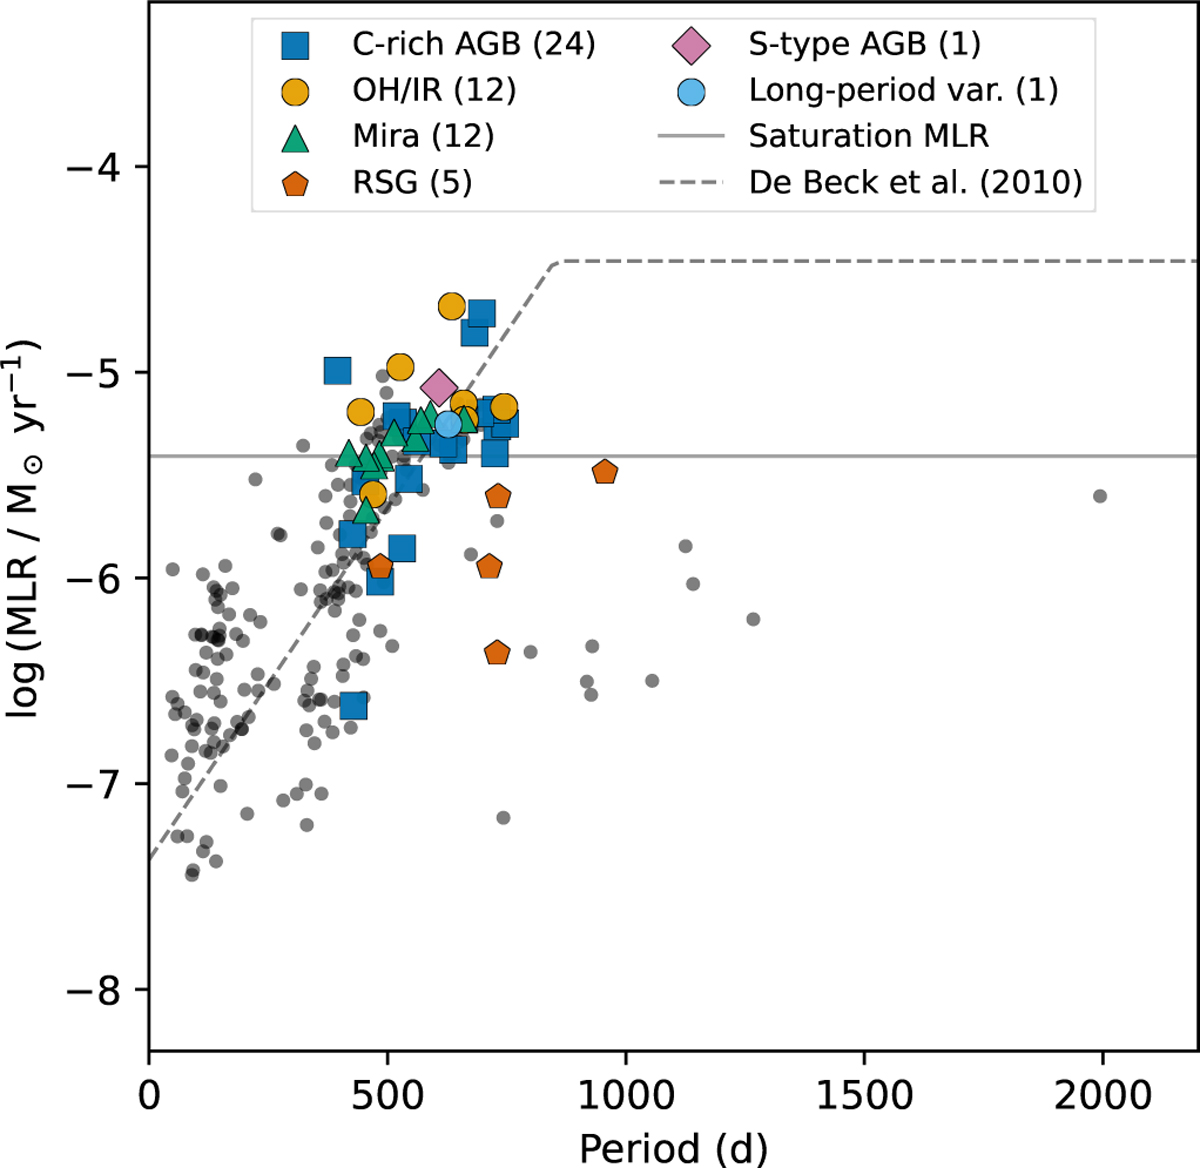
Mean MLR vs median period for our sample (grey circles). Sources with vinf>17 km s−1 are coloured according to their SIMBAD object type. The fit from De Beck et al. (2010) (dashed curve) reproduces the increasing trend in our data well. The saturation MLR from our broken-power law fit (Equation (4), solid line) is also shown for comparison.
Current usage metrics show cumulative count of Article Views (full-text article views including HTML views, PDF and ePub downloads, according to the available data) and Abstracts Views on Vision4Press platform.
Data correspond to usage on the plateform after 2015. The current usage metrics is available 48-96 hours after online publication and is updated daily on week days.
Initial download of the metrics may take a while.