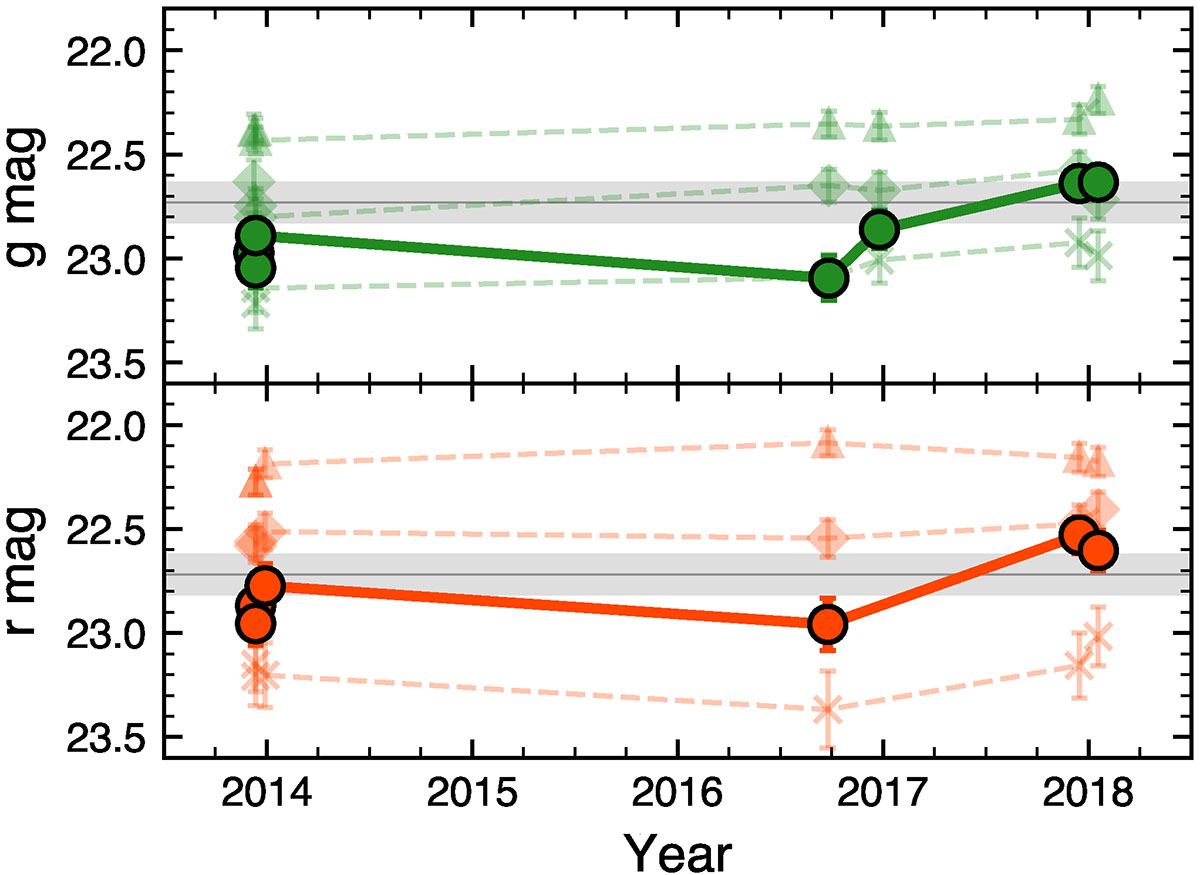
Fig. 3.
Download original image
Photometry of the progenitor candidate (solid lines) versus three nearby point sources (dashed lines) computed from individual 90 s DECam images spanning from 2013 to 2018. The grey horizontal lines denote the brightness of the progenitor candidate as computed from the stack images. The grey region represents the 1σ uncertainty on the stack image photometry for the progenitor candidate.
Current usage metrics show cumulative count of Article Views (full-text article views including HTML views, PDF and ePub downloads, according to the available data) and Abstracts Views on Vision4Press platform.
Data correspond to usage on the plateform after 2015. The current usage metrics is available 48-96 hours after online publication and is updated daily on week days.
Initial download of the metrics may take a while.