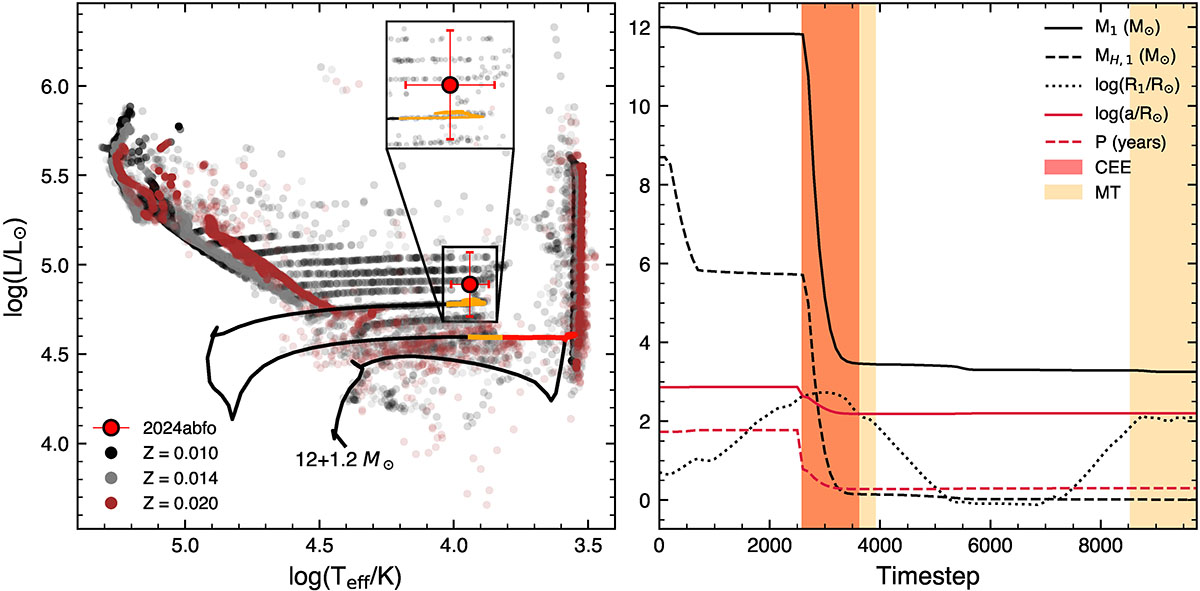
Fig. 6.
Download original image
Left: Hertzsprung-Russel diagram showing the endpoints of BPASS models for three different metallicities: Z = 0.010 (black), 0.014 (grey), and 0.020 (brown). The black line is the evolutionary track of a 12 + 1.2 M⊙ binary system with an initial period of 1.73 years. The red and orange segments of the track correspond to common envelope evolution (CEE) and mass transfer (MT) phases. The inset highlights the final evolution of the system prior to core-collapse of the primary. Right: Evolution of key parameters of the system, with the common envelope and mass transfer phases highlighted. The solid and dotted red lines denote the semi-major axis (a) and period (P). The solid and dashed black lines denote the mass of the primary star (M1) and its hydrogen envelope (MH, 1). Time steps do not correspond to equal time intervals.
Current usage metrics show cumulative count of Article Views (full-text article views including HTML views, PDF and ePub downloads, according to the available data) and Abstracts Views on Vision4Press platform.
Data correspond to usage on the plateform after 2015. The current usage metrics is available 48-96 hours after online publication and is updated daily on week days.
Initial download of the metrics may take a while.