Fig. 7.
Download original image
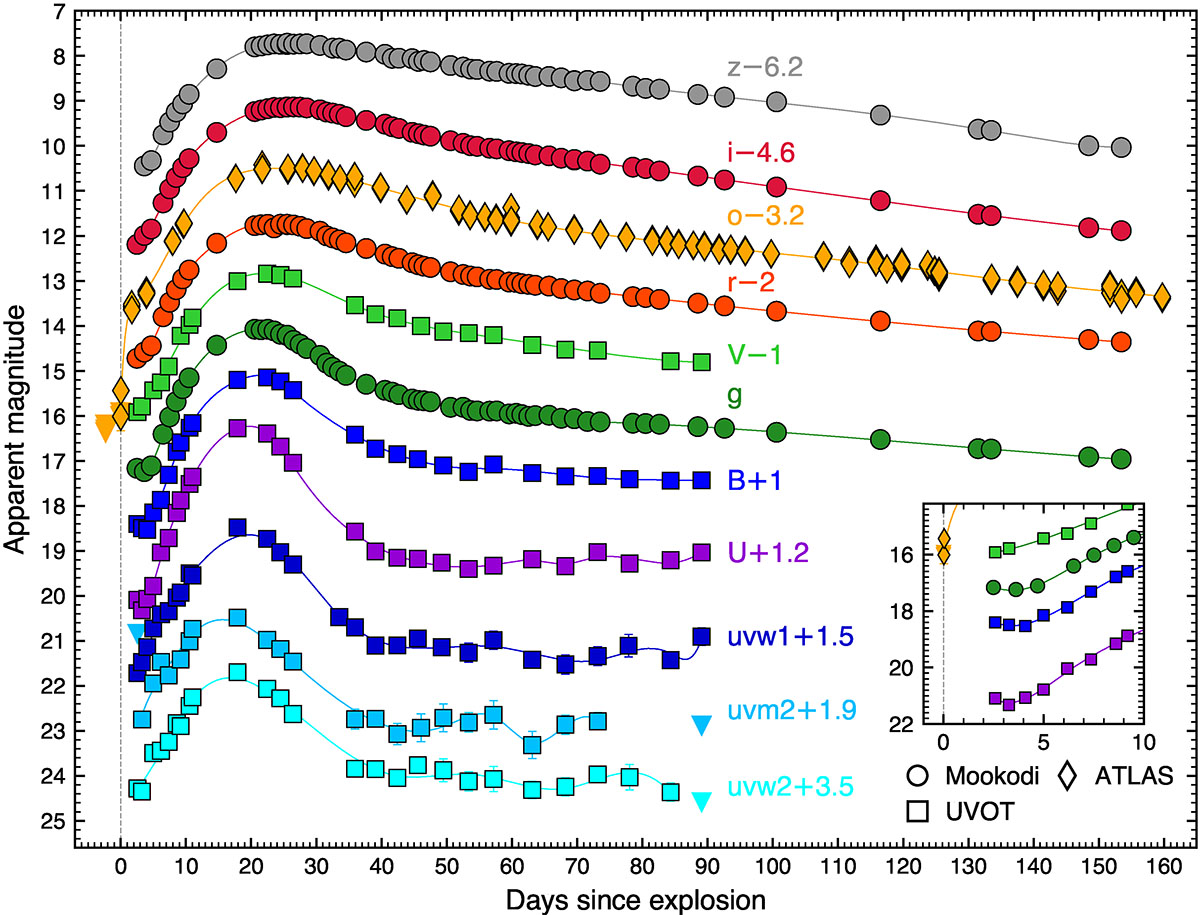
Ultraviolet/optical light curves for SN 2024abfo with smooth cubic spline fits to each light curve. Error bars are in most cases smaller than the symbols. All magnitudes are in the AB system. The vertical dotted line denotes the explosion epoch (MJD 60628.28) derived from the intra-night ATLAS discovery. Upper limits are shown with upside-down triangles and are at the 3σ level. The inset highlights the short-lived shock cooling phase visible in the g, B and U bands. The data used to create this figure are available at the CDS (see the Data availability section).
Current usage metrics show cumulative count of Article Views (full-text article views including HTML views, PDF and ePub downloads, according to the available data) and Abstracts Views on Vision4Press platform.
Data correspond to usage on the plateform after 2015. The current usage metrics is available 48-96 hours after online publication and is updated daily on week days.
Initial download of the metrics may take a while.