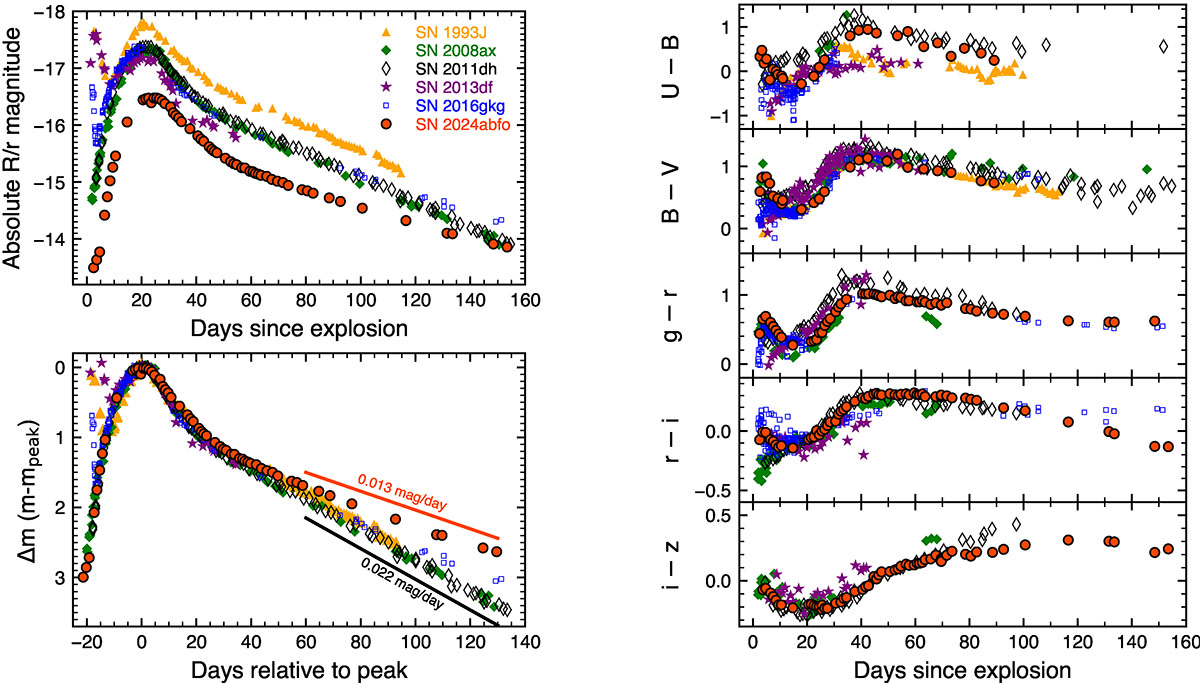
Fig. 8.
Download original image
Left: Absolute R/r-band light curves of Type IIb SNe with progenitor detections (top) and the same light curves shifted to a common peak time and magnitude (bottom). We highlight the decline rate between 60 and 140 days for SN 2024abfo and SN 2011dh. Right: Colour curves of SN 2024abfo compared to the same sample. We include data from Szalai et al. (2016) for the colour curves.
Current usage metrics show cumulative count of Article Views (full-text article views including HTML views, PDF and ePub downloads, according to the available data) and Abstracts Views on Vision4Press platform.
Data correspond to usage on the plateform after 2015. The current usage metrics is available 48-96 hours after online publication and is updated daily on week days.
Initial download of the metrics may take a while.