Open Access
Fig. 10
Download original image
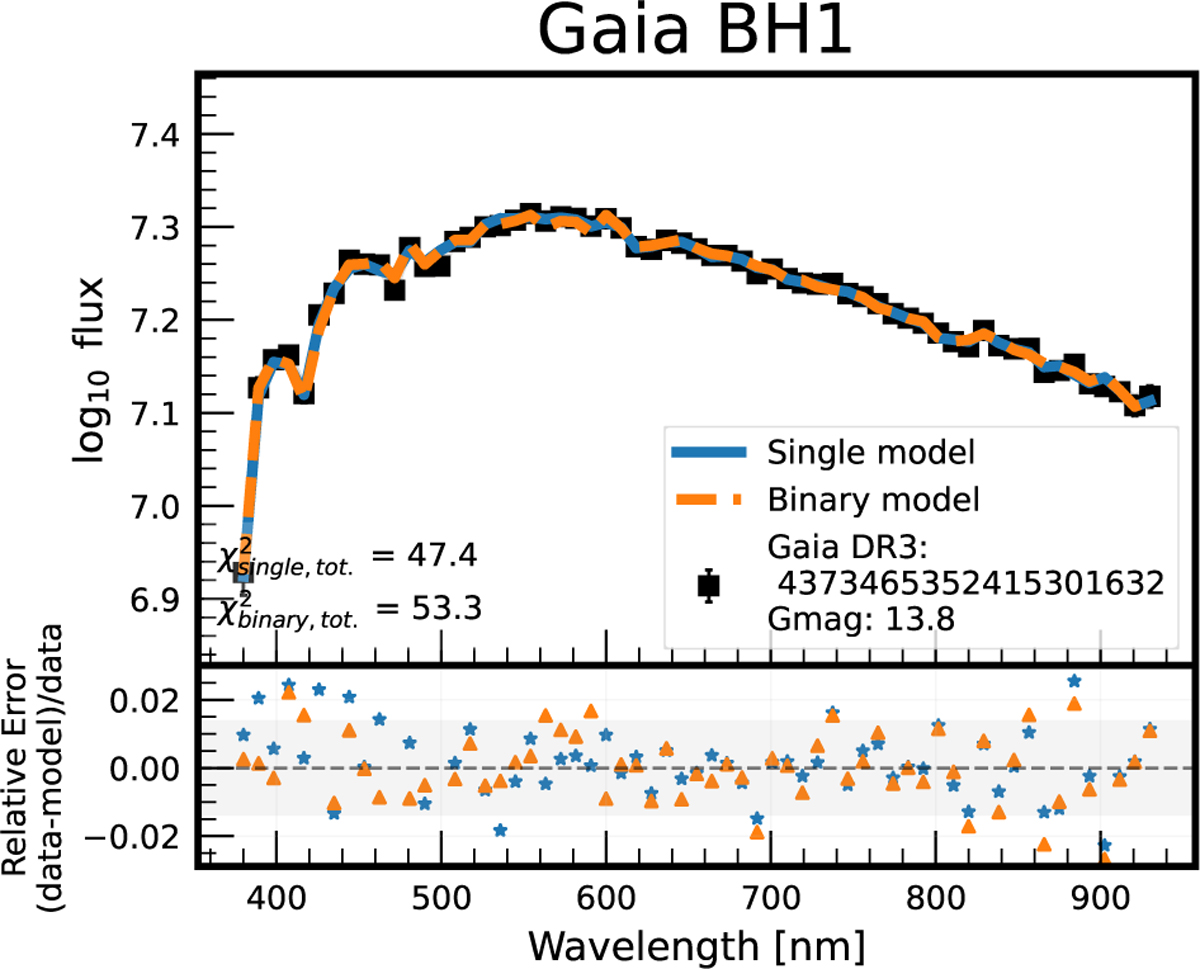
Gaia XP spectra and best-fitting models for Gaia BH1. The black line represents the observed flux. The blue solid line shows the best fit single-star model, while the orange dashed line represents the best fit binary model. Bottom inset panel: residuals (∆ log flux) for both models.
Current usage metrics show cumulative count of Article Views (full-text article views including HTML views, PDF and ePub downloads, according to the available data) and Abstracts Views on Vision4Press platform.
Data correspond to usage on the plateform after 2015. The current usage metrics is available 48-96 hours after online publication and is updated daily on week days.
Initial download of the metrics may take a while.