Fig. 11
Download original image
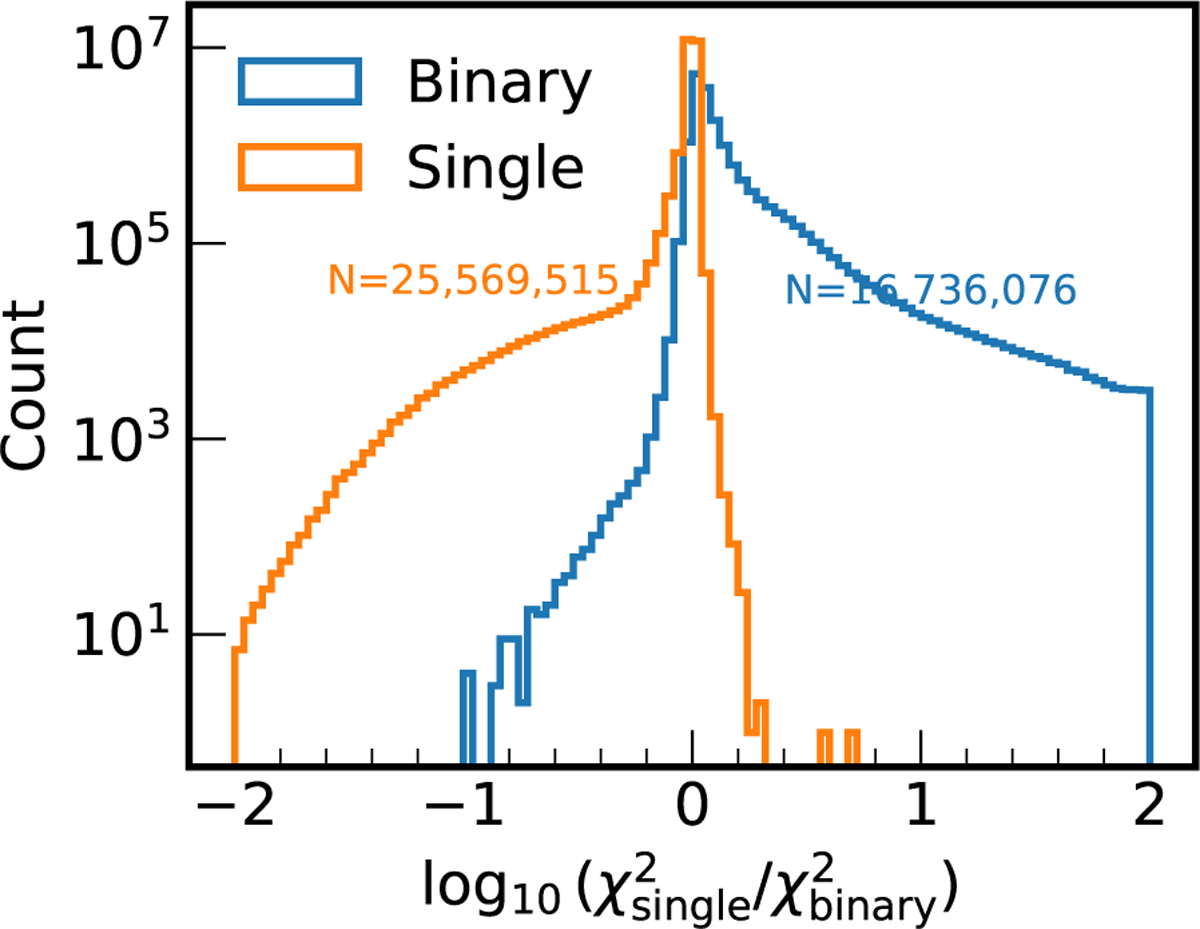
Distribution of ![]() for a subset of Gaia DR3 XP spectra, illustrating the statistical separation between single-star and binary models. The histogram shows the frequency of sources as a function of ∆χ2, with the classifiation based on an optimal threshold S (calibrated to maximize the Fβ-score with β = 0.5) used to classify binary systems.
for a subset of Gaia DR3 XP spectra, illustrating the statistical separation between single-star and binary models. The histogram shows the frequency of sources as a function of ∆χ2, with the classifiation based on an optimal threshold S (calibrated to maximize the Fβ-score with β = 0.5) used to classify binary systems.
Current usage metrics show cumulative count of Article Views (full-text article views including HTML views, PDF and ePub downloads, according to the available data) and Abstracts Views on Vision4Press platform.
Data correspond to usage on the plateform after 2015. The current usage metrics is available 48-96 hours after online publication and is updated daily on week days.
Initial download of the metrics may take a while.