Fig. 13
Download original image
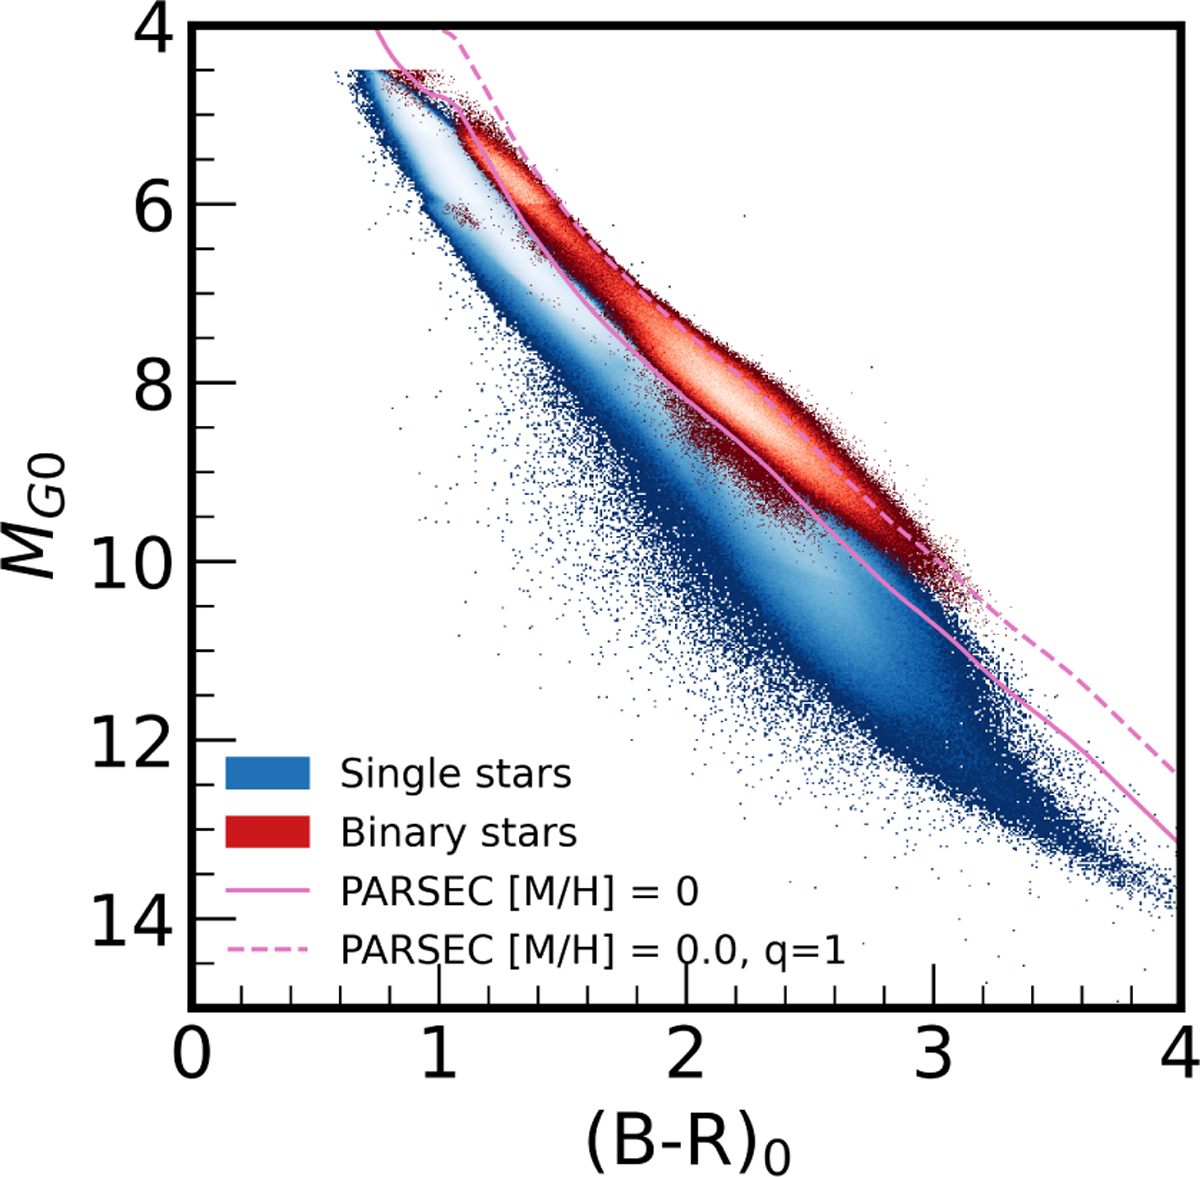
HR diagrams for golden binary sample of mass-ratio >0.9. The background blue shows the density distribution of selected single stars in, with the scale bar indicating the logarithmic number of stars per bin. The pink solid and dashed lines show PARSEC isochrones (Bressan et al. 2012) for [M/H]=0, and q = 1 binary configurations.
Current usage metrics show cumulative count of Article Views (full-text article views including HTML views, PDF and ePub downloads, according to the available data) and Abstracts Views on Vision4Press platform.
Data correspond to usage on the plateform after 2015. The current usage metrics is available 48-96 hours after online publication and is updated daily on week days.
Initial download of the metrics may take a while.