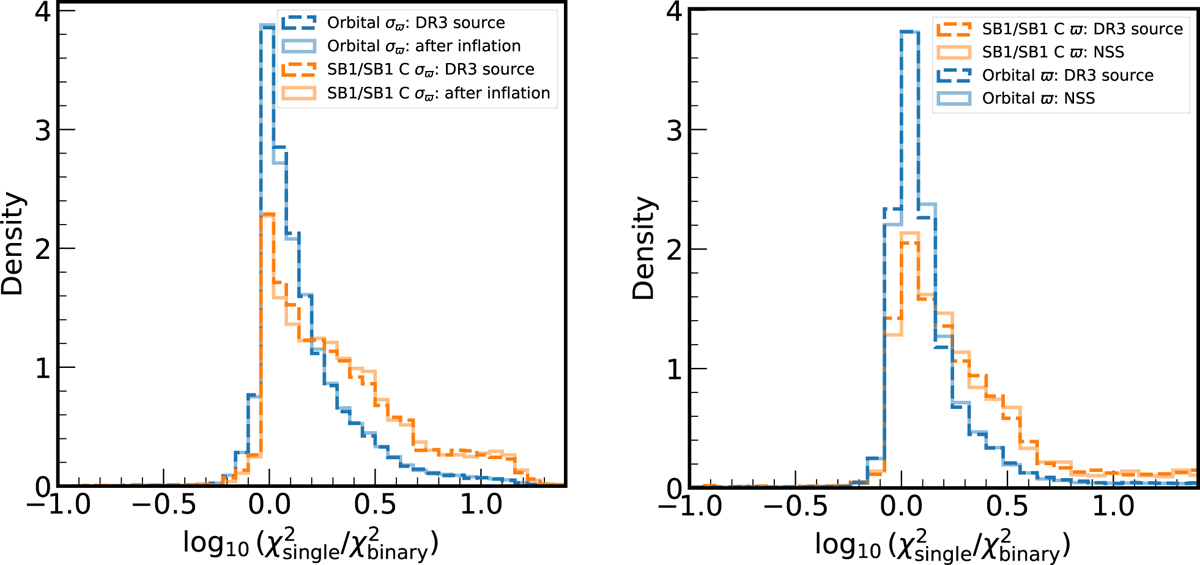
Fig. 15
Download original image
Distribution of the logarithmic χ2 improvement for binary models. In each panel, blue lines denote astrometric binary stars classified by the NSS catalog, while orange lines represent SB1 binaries. In the left panel, the dashed lines are derived from the original DR3 source catalog parallax errors, while solid lines show results after error inflation following the model of El-Badry (2025). In the right panel, the dashed lines use parallaxes from the DR3 source catalog, while solid lines use parallaxes from the NSS catalog, which incorporate binary orbital solutions in their parallax estimates.
Current usage metrics show cumulative count of Article Views (full-text article views including HTML views, PDF and ePub downloads, according to the available data) and Abstracts Views on Vision4Press platform.
Data correspond to usage on the plateform after 2015. The current usage metrics is available 48-96 hours after online publication and is updated daily on week days.
Initial download of the metrics may take a while.