Fig. B.1
Download original image
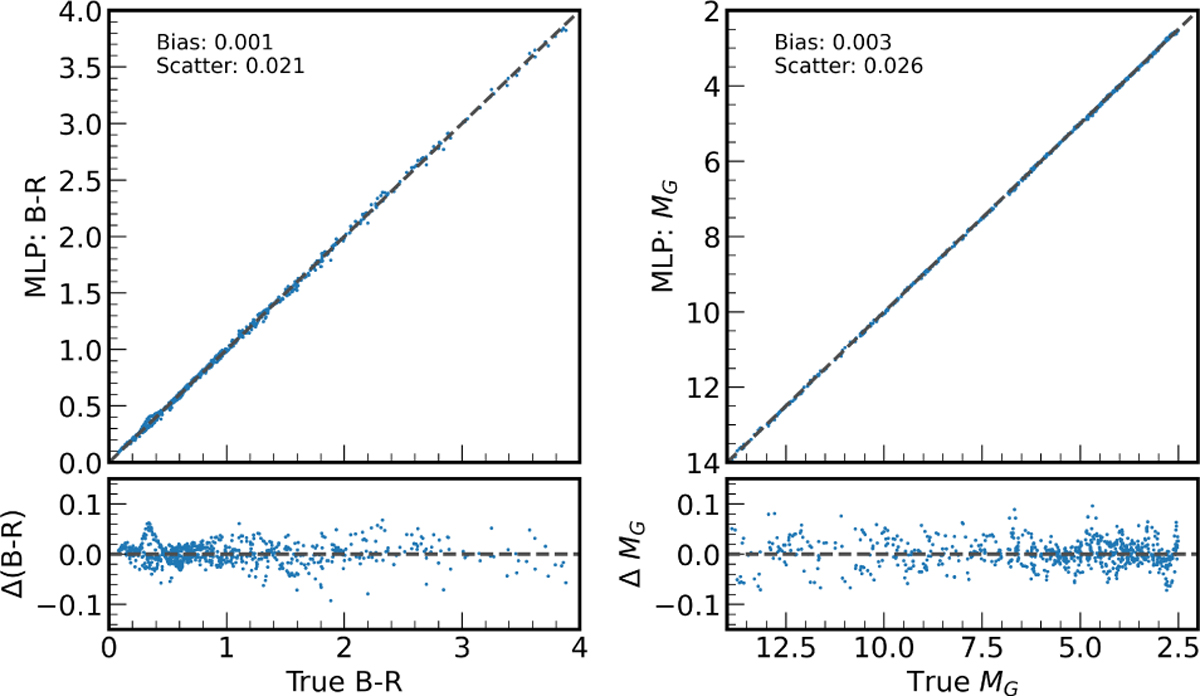
Validation of the neural network-based mapping function ℳ that translates stellar physical parameters to H-R diagram coordinates. Left panels: Comparison between true and predicted B-R color, showing good agreement with minimal bias (0.001) and scatter (0.021). Right panels: Validation of absolute G-magnitude (MG) predictions, displaying negligible bias (0.003) and low scatter (0.026). The bottom panels show residuals (predicted minus true values) across the parameter range, demonstrating no systematic trends.
Current usage metrics show cumulative count of Article Views (full-text article views including HTML views, PDF and ePub downloads, according to the available data) and Abstracts Views on Vision4Press platform.
Data correspond to usage on the plateform after 2015. The current usage metrics is available 48-96 hours after online publication and is updated daily on week days.
Initial download of the metrics may take a while.