Fig. 2
Download original image
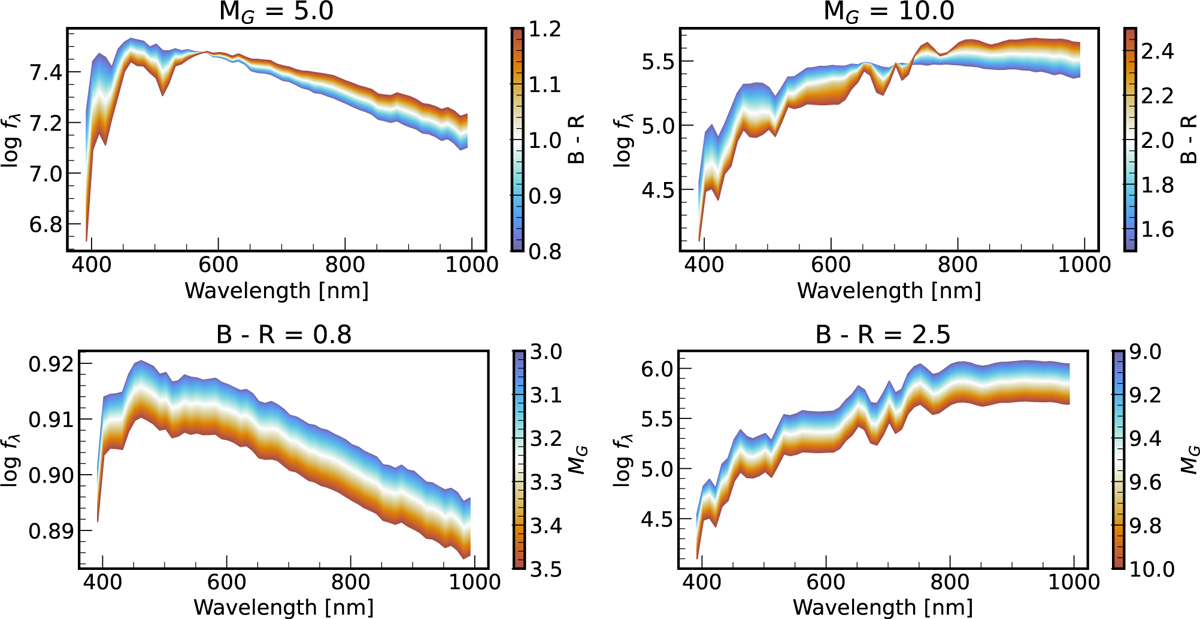
Demonstration of our NN spectral emulators for single main-sequence stars. Each panel shows the predicted XP spectra with different stellar parameters, where the x-axis is the wavelength and the y-axis is the logarithmic flux (10−20 W m−2 nm) normalized to a distance of 10 pc. Top panels: spectra at fixed absolute G magnitude (MG) with different B − R color. Bottom panels: spectra at fixed B-R color with varying MG.
Current usage metrics show cumulative count of Article Views (full-text article views including HTML views, PDF and ePub downloads, according to the available data) and Abstracts Views on Vision4Press platform.
Data correspond to usage on the plateform after 2015. The current usage metrics is available 48-96 hours after online publication and is updated daily on week days.
Initial download of the metrics may take a while.