Fig. 6
Download original image
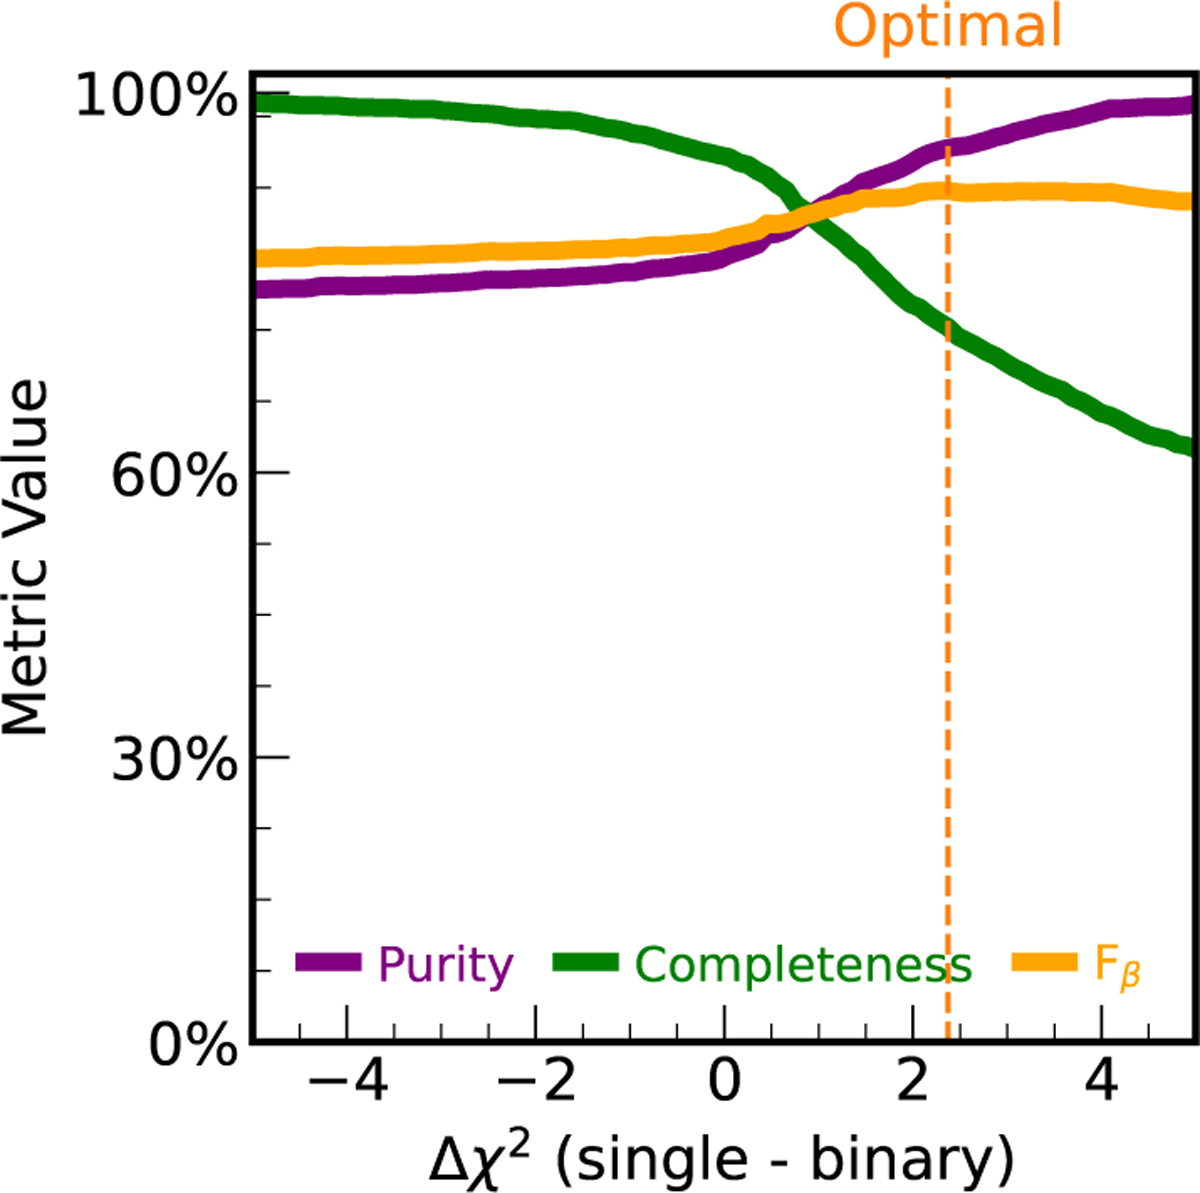
Performance metrics as a function of the difference between χ2 single and χ2 binary values. The plot shows purity (precision, purple line), completeness (recall, green line), and Fβ score (orange line) across different threshold values, where β = 0.5. The vertical dashed line is the χ2 threshold that maximum the Fβ score. Beyond this threshold, completeness decreases most rapidly, followed by Fβ score, while purity remains high.
Current usage metrics show cumulative count of Article Views (full-text article views including HTML views, PDF and ePub downloads, according to the available data) and Abstracts Views on Vision4Press platform.
Data correspond to usage on the plateform after 2015. The current usage metrics is available 48-96 hours after online publication and is updated daily on week days.
Initial download of the metrics may take a while.