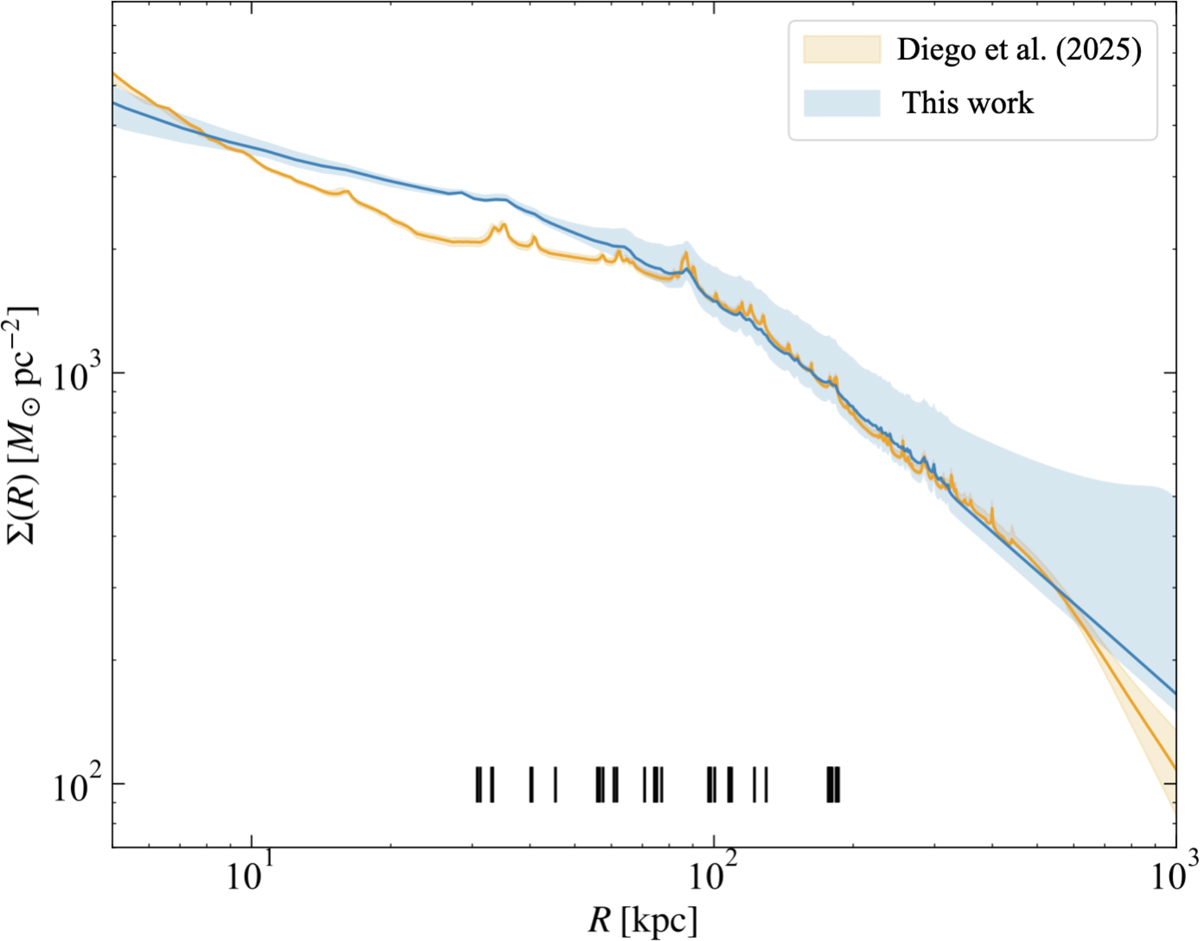
Fig. 10.
Download original image
Surface mass density profile of A2390 as a function of the distance from the BCG. The blue (orange) solid line corresponds to this work (the lens model by Diego et al., in prep.). The light blue area quantifies the systematic uncertainty enclosing the minimum and maximum values of the mass profiles for all 11 models explored in this work. The light orange area is estimated as described in Diego et al. (2025). The vertical black lines in the bottom part of the plot are the projected distances from the BCG of the 35 multiple images included in our models.
Current usage metrics show cumulative count of Article Views (full-text article views including HTML views, PDF and ePub downloads, according to the available data) and Abstracts Views on Vision4Press platform.
Data correspond to usage on the plateform after 2015. The current usage metrics is available 48-96 hours after online publication and is updated daily on week days.
Initial download of the metrics may take a while.