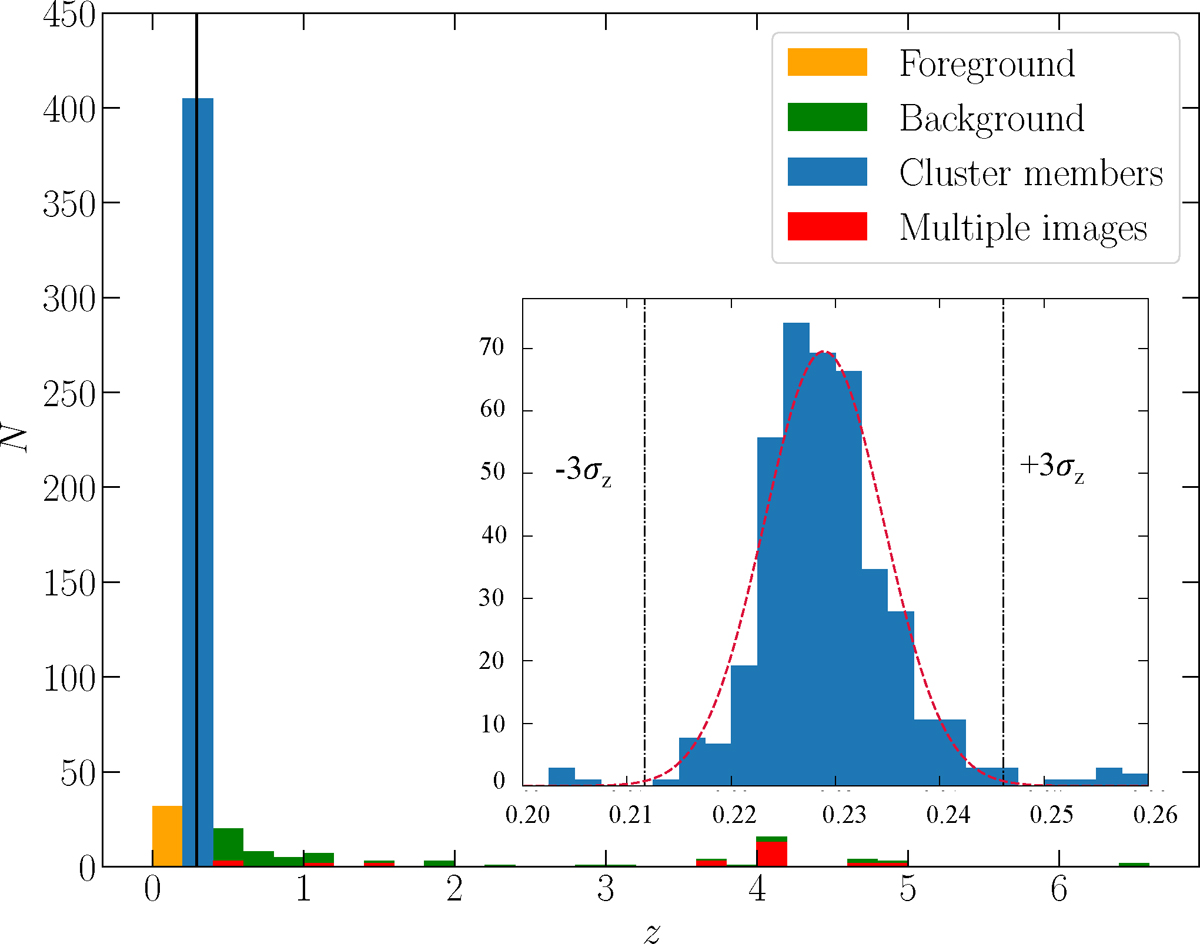
Fig. 2.
Download original image
Spectroscopic redshift distribution of the objects in our final spectroscopic catalogue. Cluster members (i.e. lying in the redshift range from z = 0.211 to z = 0.251) are in blue, whereas foreground and background objects are in orange and green, respectively. Multiple images are depicted in red. The vertical black line locates the redshift of the galaxy cluster. The insert shows the cluster members selection illustrated in Sect. 3.1. The dashed red line identifies the best-fit Gaussian distribution, whereas the vertical black dotted lines define an interval of ±3σz around the median cluster redshift.
Current usage metrics show cumulative count of Article Views (full-text article views including HTML views, PDF and ePub downloads, according to the available data) and Abstracts Views on Vision4Press platform.
Data correspond to usage on the plateform after 2015. The current usage metrics is available 48-96 hours after online publication and is updated daily on week days.
Initial download of the metrics may take a while.